10 days til Policy Bingo begins in earnest.
Hello. It’s Friday. Thanks for signing up. I’m Brent Donnelly.
The About Page for Friday Speedrun is here.

10 days til Policy Bingo begins in earnest.

Hello. It’s Friday. Thanks for signing up. I’m Brent Donnelly.
The About Page for Friday Speedrun is here.
Here’s what you need to know about markets and macro this week
Try Spectra School for free!

If you’re looking for a good way to spend 35 minutes or so, check out Lesson 3 of our flagship course “Think Like a Market Professional” for free. https://spectramarkets.com/lessons/tlmp3/ There, you will find the entirety of Lesson 3, for free, along with a link to my Learning From Legends video with Ben Hunt.
The lesson is called “Surfing the Narrative Cycle” and delves into how you can understand the stories the market is telling itself. If you like it, you can sign up for the full course and use coupon code LESSON3 for $250 off the $1200 price (i.e., you pay $950 for 16 lessons and 10+ videos.)
This week saw a flurry of negatives build up for risky assets as the long end of the bond market continues to feel the heat of scary deficits, sticky / rising inflation, and some strong US data. The market can climb a wall of worry for a while, but at some point, the fear trade kicks in, and things go south.
The biggest scary thing this week might have been more micro than macro as Nvidia CEO Jensen Huang unveiled a litany of super awesome and exciting products at CES 2025 and the stock traded up for about 8 hours then down hard. This sort of good news / bad price behavior is typical of what you see at the highs in overstretched sector trades. We’ll get more into this in the section on stocks, but NVDA wasn’t the only hot stock to get trashed this week.
In the UK, the market is using Liz Truss’ name in vain as the bond vigilantes make a return after a two-year hiatus. The textbook says that when a developed country’s yields go up, their currency should rally in tandem, and when there is a fear of fiscal danger, you get higher yields and a lower currency at the same time. That toxic mix is on display in England right now.
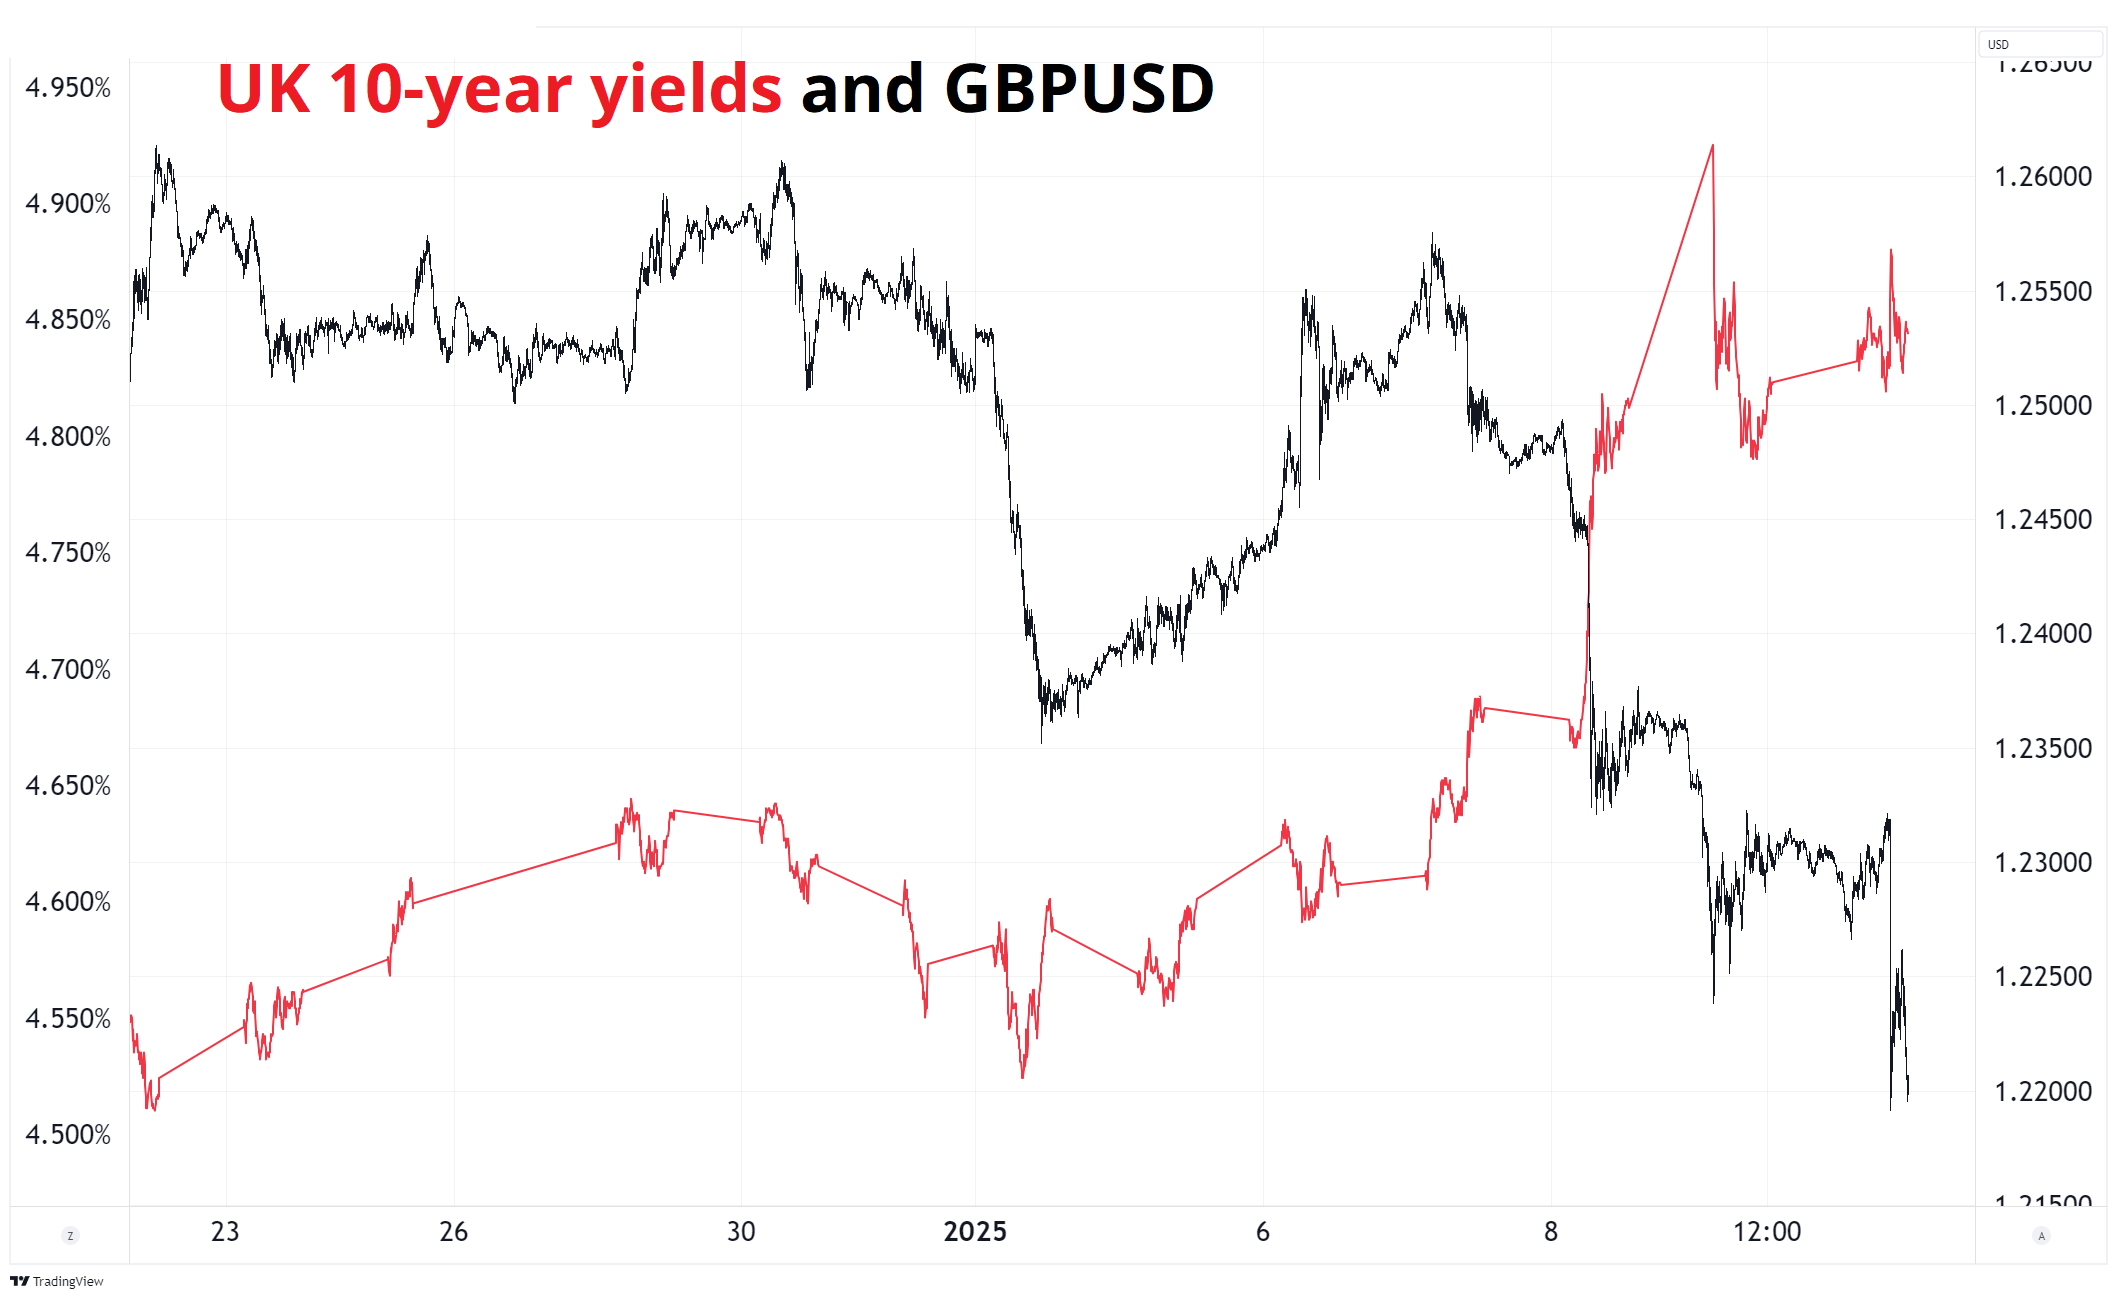
In normally-functioning, happy markets, the red line and the black bars should be moving in the same direction, but you can clearly see that’s not the case right now. UK gilts are getting hit, and so is the currency.
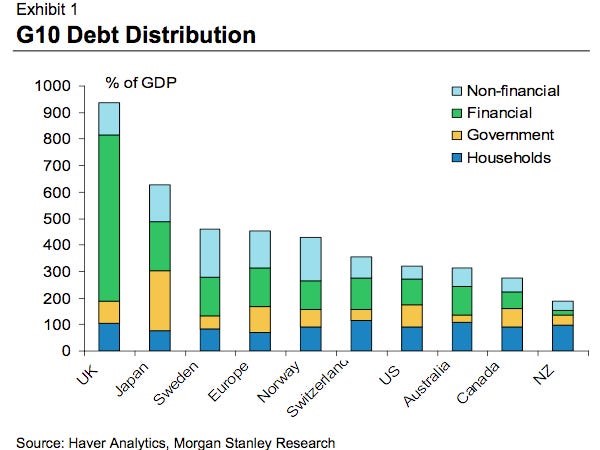
Comparing debt levels between countries is hard because it depends a lot on what source you use and what you do or do not include in the debt figure, but this chart from Morgan Stanley is rather picante.
You also got a Trudeau resignation in Canada, which some thought might take the heat off the tariffs story, but then Trump did a presser yesterday and doubled down on the Canada thing, citing autos and lumber as two sectors where Canada was selling to the United States for no good reason.
The Canadian situation is weird as parliament has prorogued until March, the ruling party has no leader, and an election isn’t likely until March or April at the earliest. This creates a nice opening for a disorderly selloff in the CAD if Trump puts some sort of broad tariff on Canadian exports when he takes office on January 20.
No discussion of global macro would be complete without a brief mention of the balance sheet recession and deflationary boom sucking China’s economy down down down. They stopped buying bonds this week to stop the deflationary signal that might be sending but that’s a bit like putting a thermometer into ice to make the temperature go down.
Anyway, Tepper’s God status has been downgraded to demigod as his bold “FK VAR I’M ALL IN LONG CHINA” call looks a bit offside for the moment. Here’s China A Shares in all their glory.
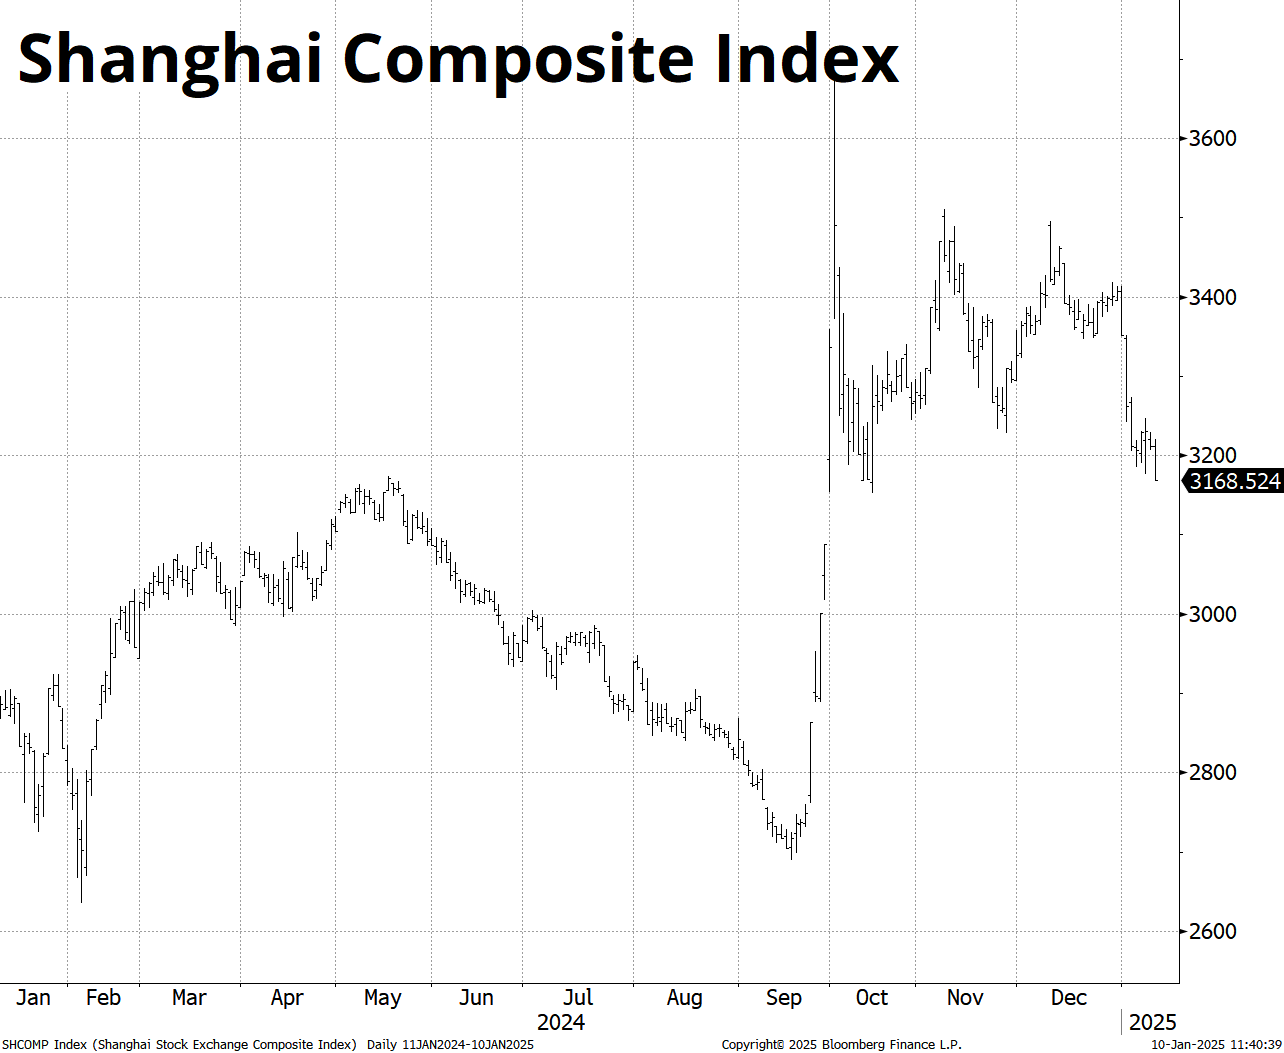
That puts the super-popular ASHR ETF at 25.00 and puts the sellers of the $26 puts in a bit of a quandary. (Selling $26 ASHR puts was one of the most popular trades in September and October 2024). Will Team China show up and rip the stonks higher again? Or are they going to hide under the desk until we get to 2800 on the index? Yuck.
Don’t forget to buy the 2025 Spectra Markets Trader Handbook and Almanac here.
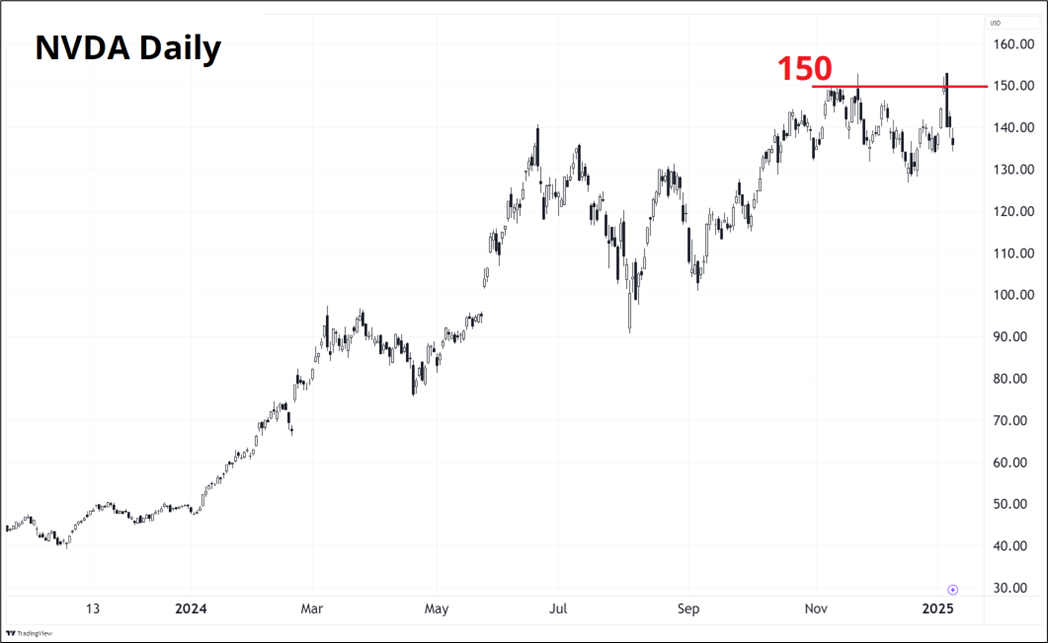
The chart of the week award has been awarded to NVDA by unanimous vote.
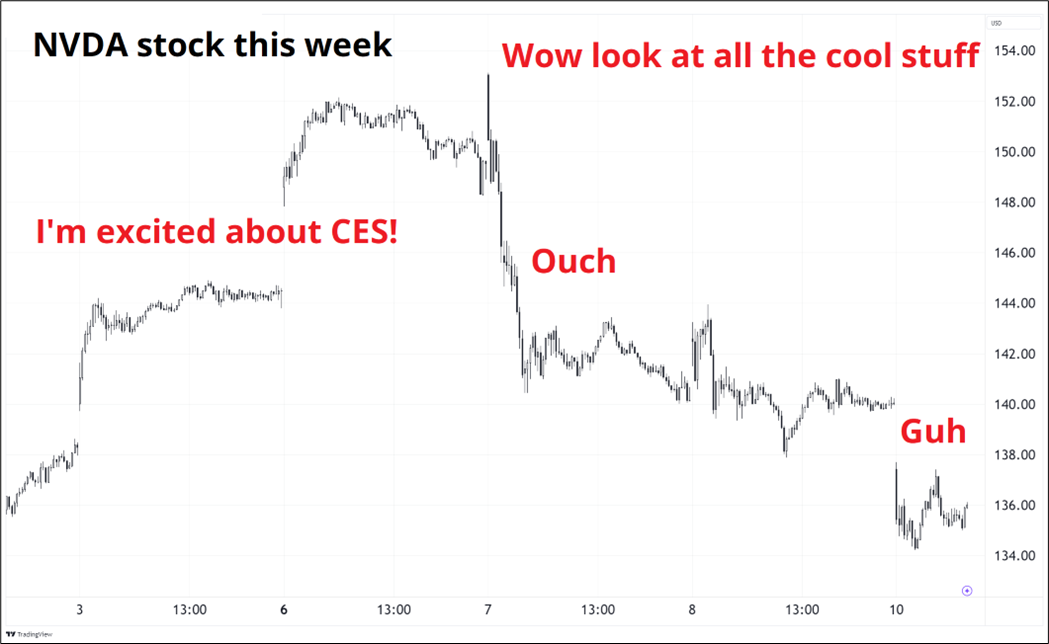
This chart would be ugly enough on its own, but it comes in the context of a false break of the all-time highs and so now it looks like a major, possibly medium-term, rejection. There have been many false dawns for NVDA bears, but the sun might actually be coming up for them here.
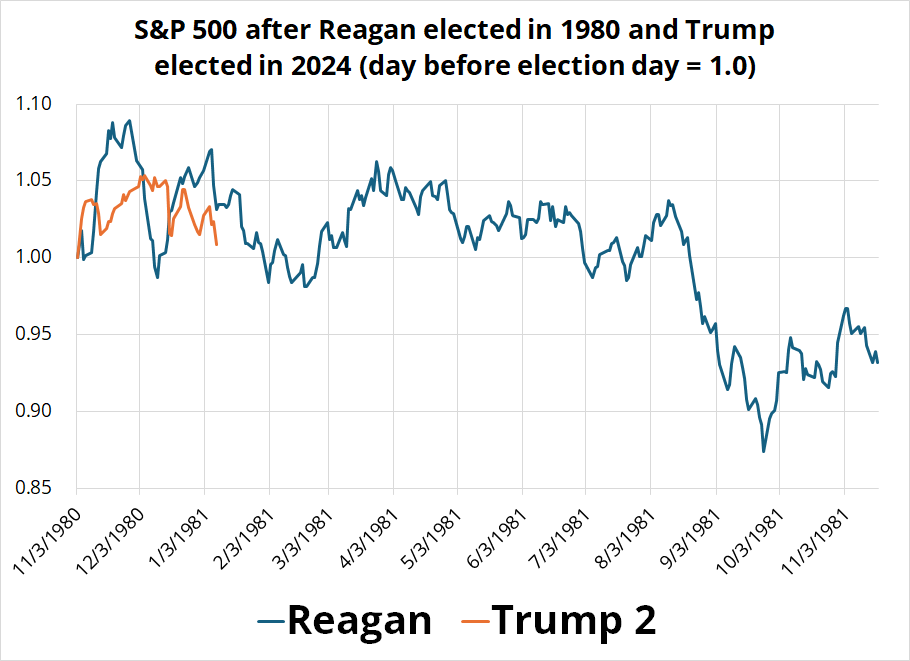
The vibe now is similar to after the 1980 election, when Reagan brought the promise of extreme deregulation and business-friendly policies. Stocks rallied after that election, then sold off for a year. The charts don’t rhyme perfectly or anything, but the point is that a deregulation guy can come in and get everyone excited and then stocks can still subsequently soil the bedsheets if they want to. Plenty was different then, but the point stands.
This week’s 14-word stock market summary:
The correction has begun, and corrections often go further than people expect them to.
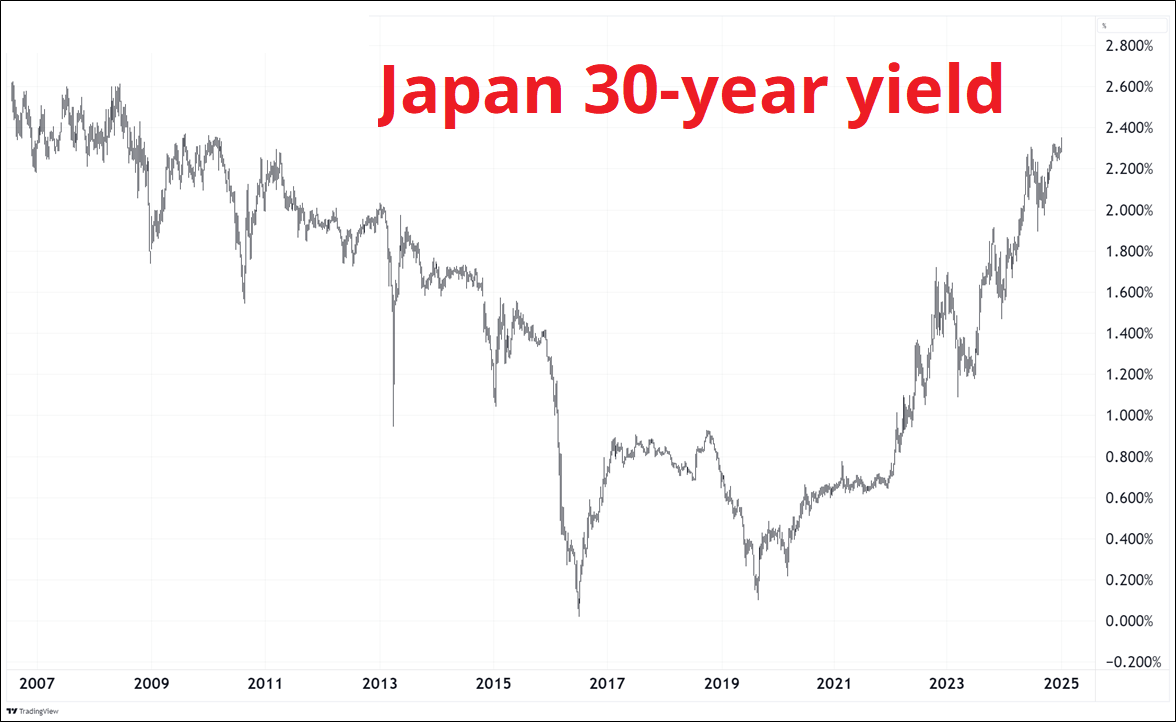
The super zoomed out monthly chart of 30-year yields is a thing of beauty.
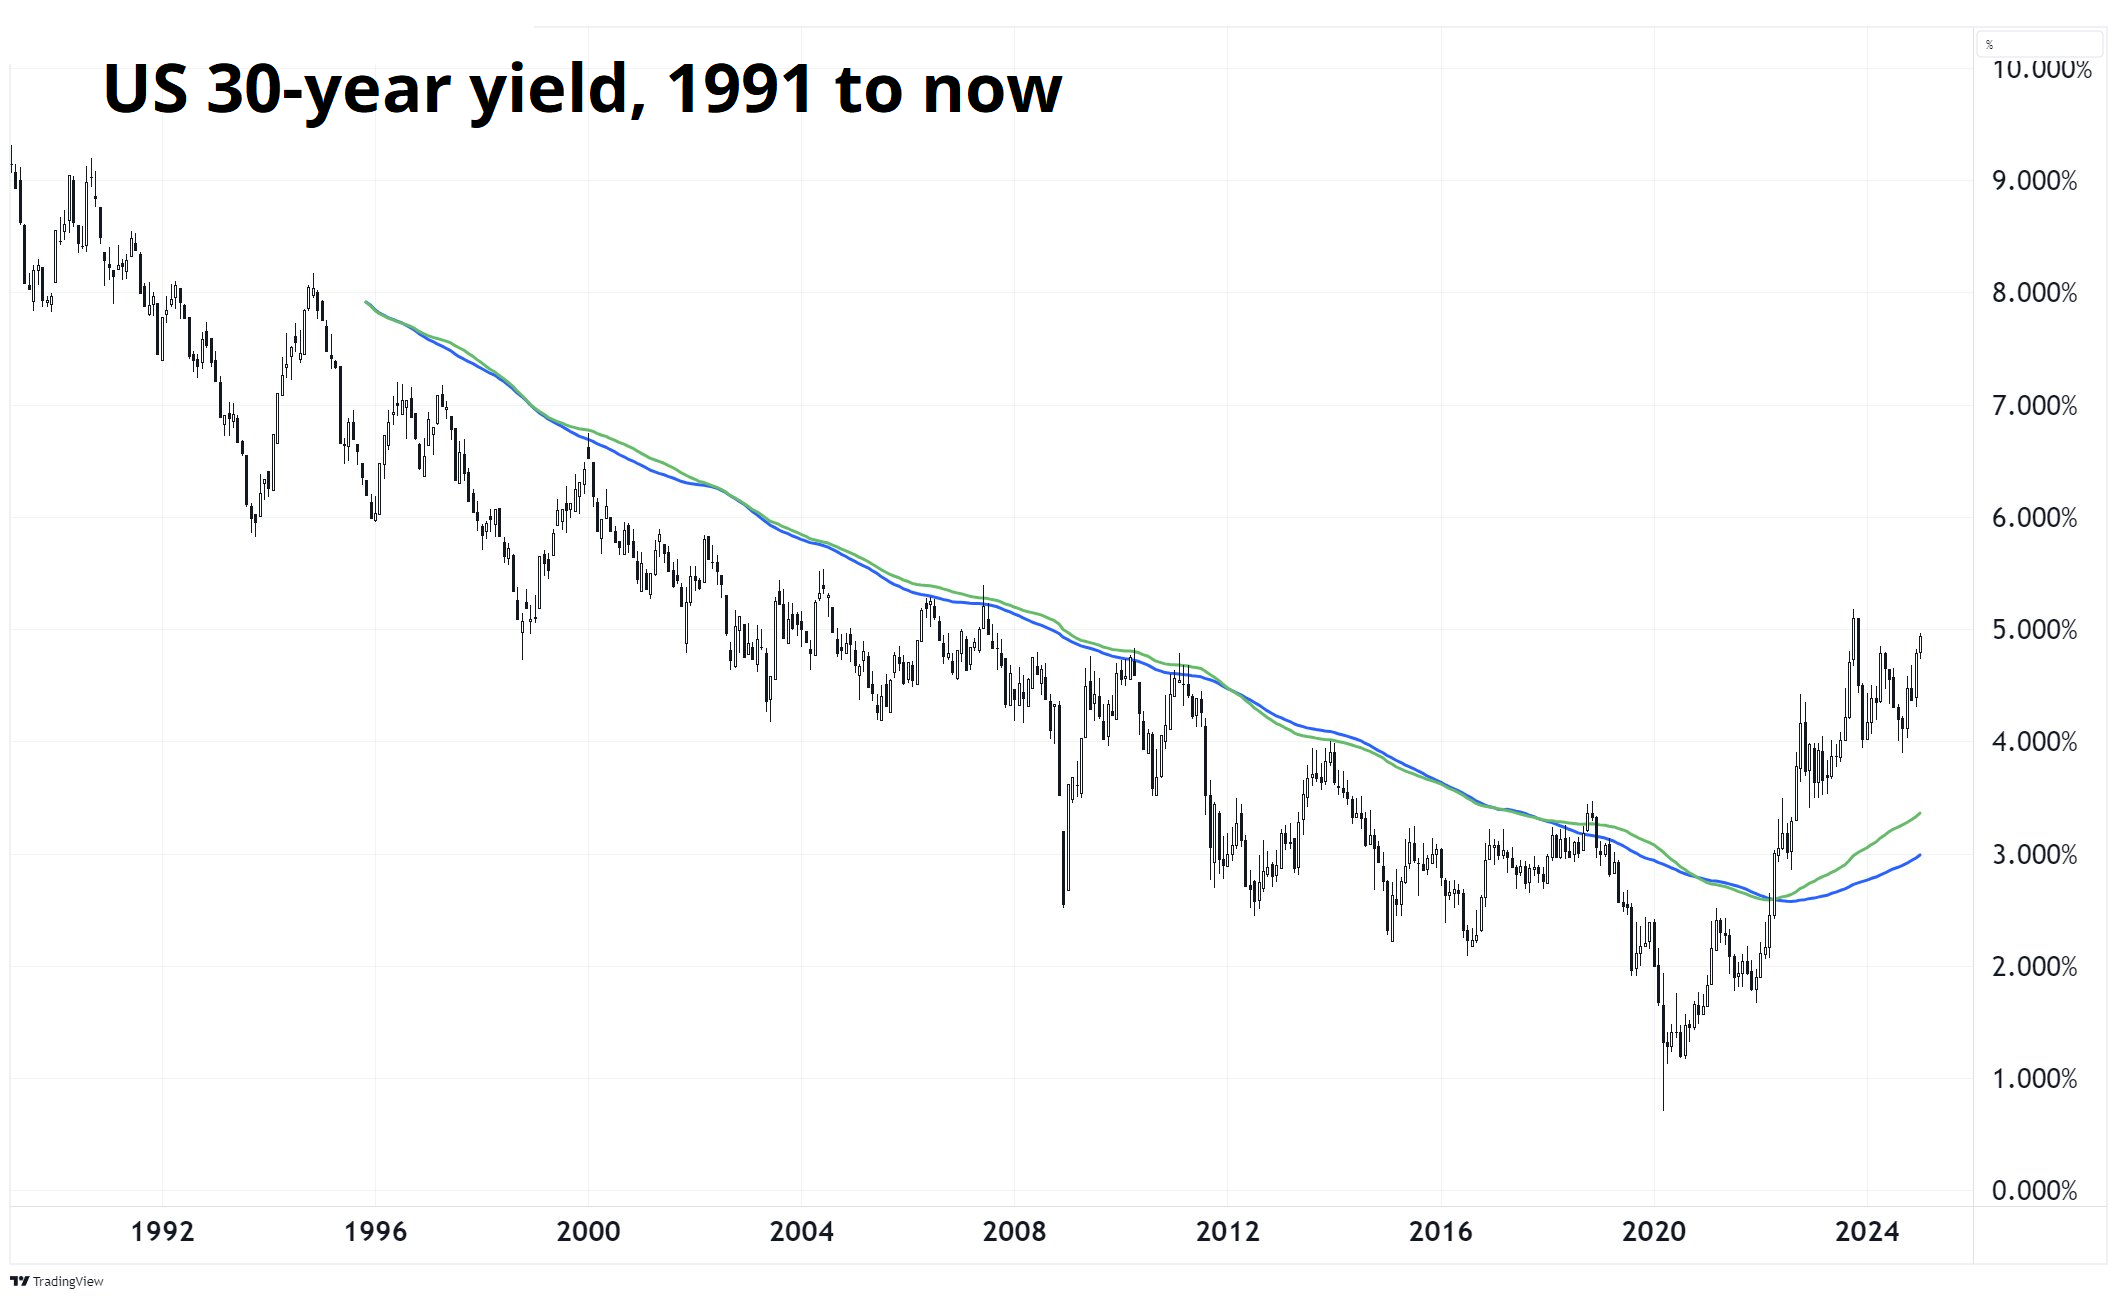
What a toxic combination of risk premium, sticky inflation, and stronger-than-expected jobs for the bond market. It creates a challenging setup for risky assets as we start to look back to 2022 as a comparison. Stock/bond correlation looks ready to inflict pain on 60/40 much as it did that year as high inflation required a massive jam of the brakes from the Fed.
This time, the persistently high and now higher yields risk allowing the long and variable lags to kick in at some point. The velocity of the move is not staggering (outside the UK) but the persistence is going to be a problem at some point.
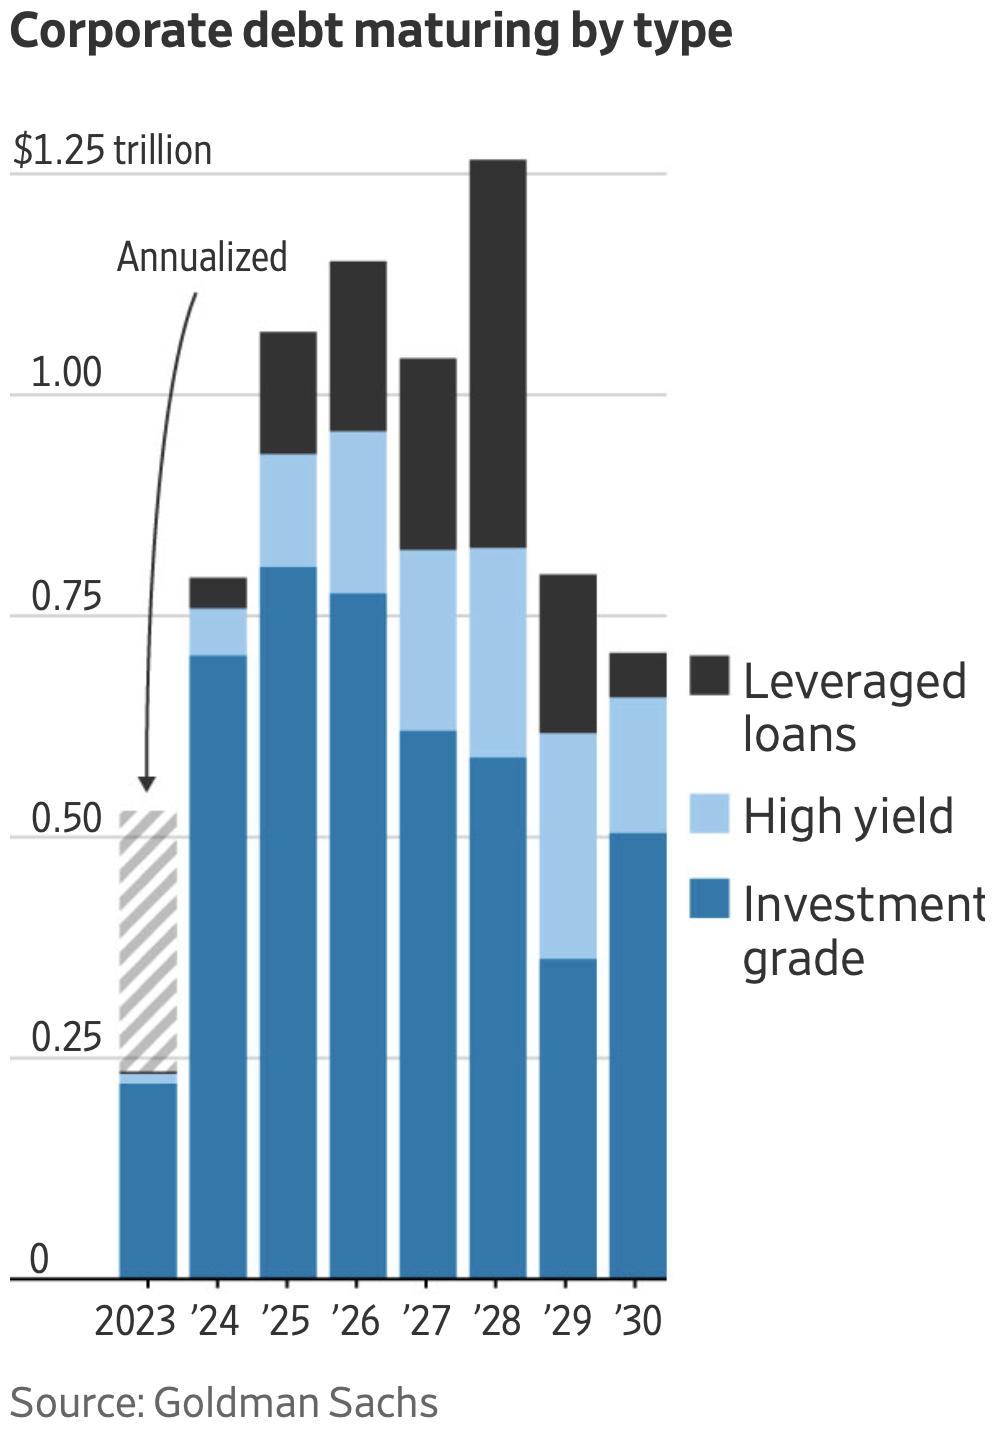
The unusual combination of massive cash balances on the asset side and fixed liabilities in the United States made rate hikes neutral or stimulative in 2023 and 2024, but it’s hard to imagine that remains the case in 2025. Mortgages are going to start to reset a bit, even in the US. Corporates are going to need to roll some debt.
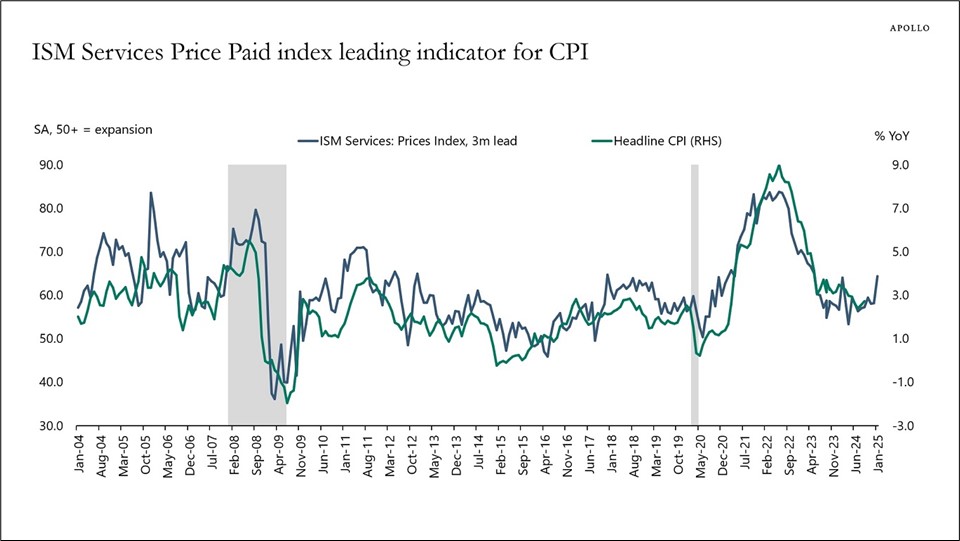
Meanwhile, inflation is sticky, commodity prices have turned back up, and the Prices Paid component of ISM Services (which is a good lead indicator for CPI), is flicking higher too. This chart from Torsten Sløk captures it.
And then the Michigan Survey did this at 10:00 a.m. today:
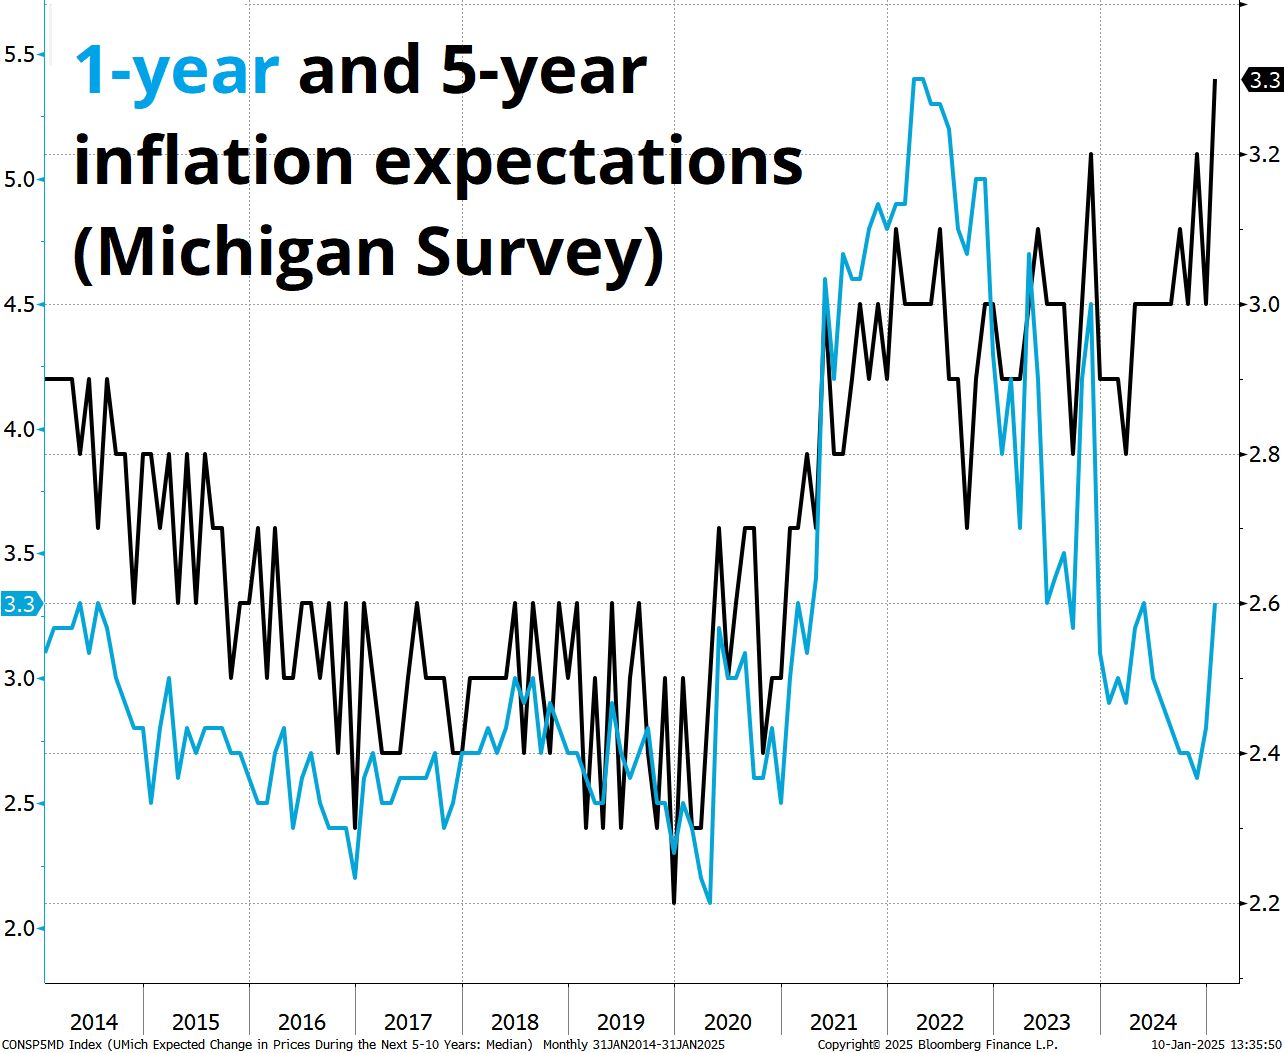
That’s incredibly sticky 5-year inflation expectations and a zoomy ramp up in the 1-year figure. The shorter-term number is volatile, obviously, but the persistence of that 5-year thing is not great news for a Fed that is cutting interest rates into a still-booming economy.
There is a whole stack of literature about inflation expectations and whether or not they matter, but it’s really boring and inconclusive. The point for markets right now is that this is another indicator that will sway sentiment at the Fed given there was already quite a bit of dissent over the last cut and certainly no support for another one now. The banks are moving their rate cut forecasts out to reflect current market pricing.
“But wait,” you might say, “If they are just moving their forecasts to follow market pricing, are those actually forecasts?”
Good question. No. They’re not really forecasts. They’re more like an equation something like:
f = (current market level +/- dovish or hawkish worldview) Updated monthly.
Here’s how that has worked out over time.
Effective Fed Funds rate versus market expectations
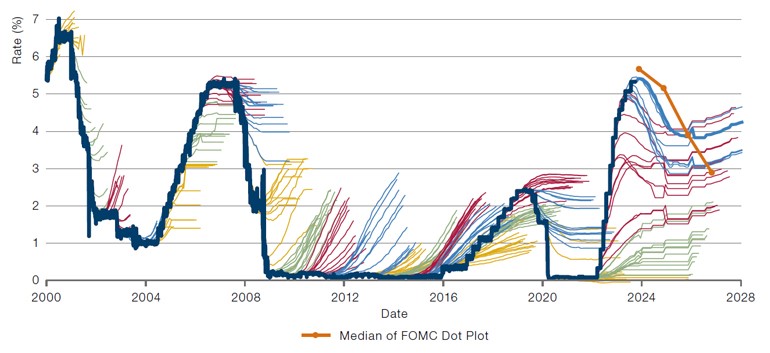
https://www.man.com/maninstitute/views-from-the-floor-2023-October-10
That chart is more hirsute than Tom Selleck circa 1982.

I’m sorry if that photo makes you feel uncomfortable. Here’s a palate cleanser that shows you how the recent bond market rally is more about term premium and inflation fear, not strong US data.
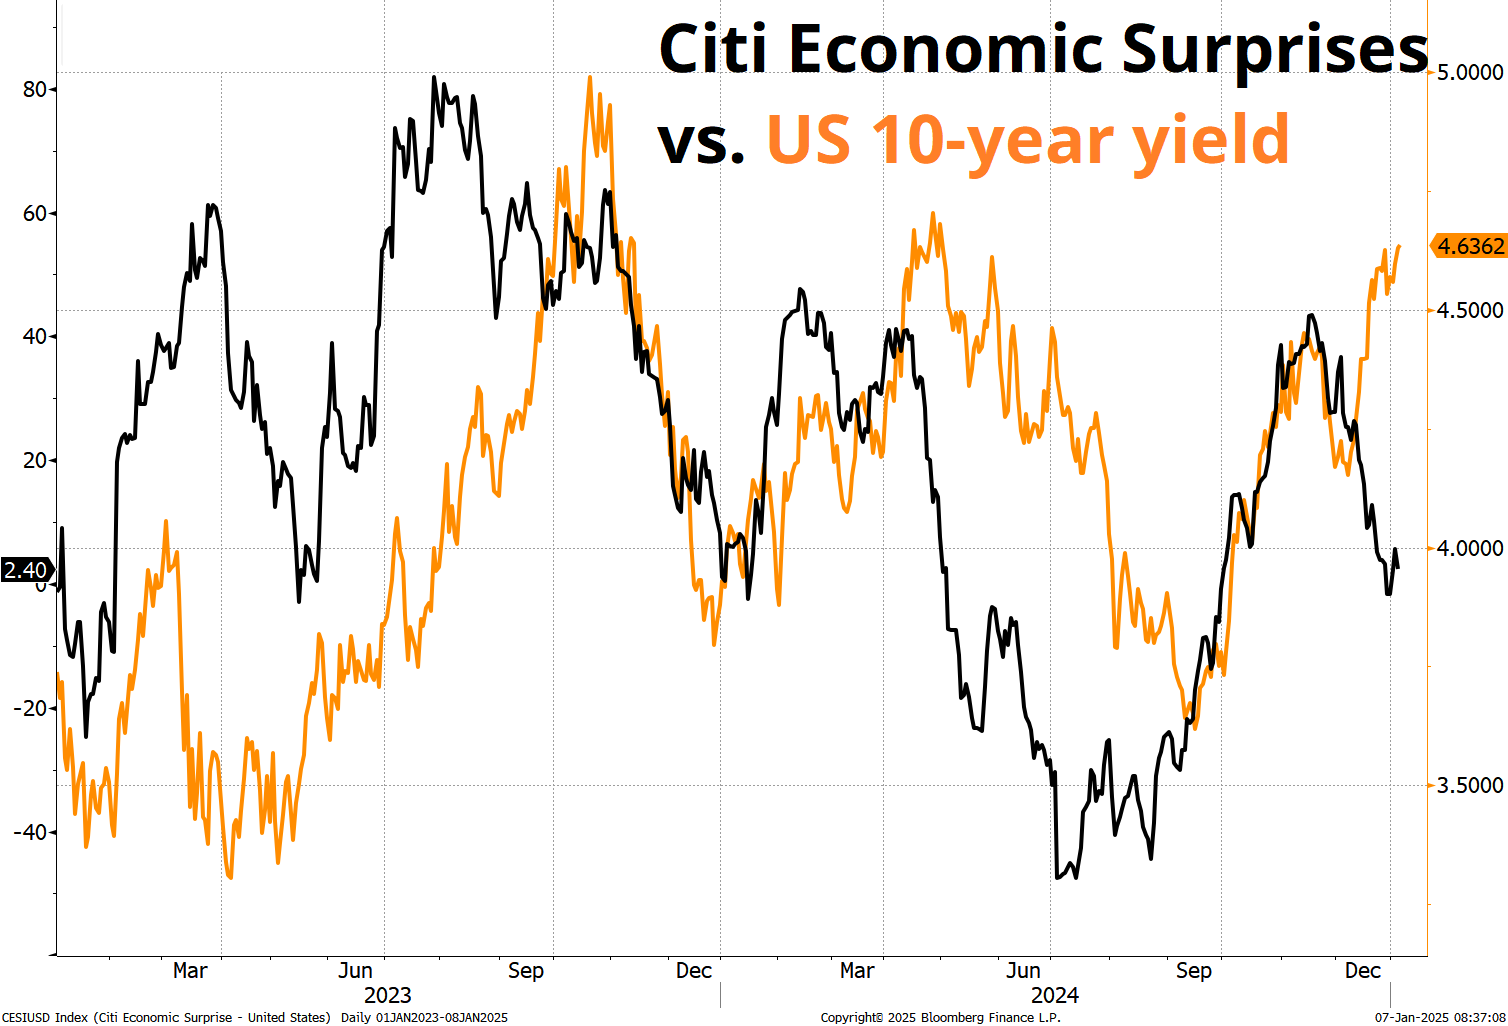
You still got Tom Selleck seared into your occipital lobe? Try this:
For the blessed greenback, it all comes back to the three main outcomes:
1. Large blanket tariffs in January. USD rallies 3% to 5%.
2. Smaller, targeted tariffs with potential to scale up if border control or other conditions are not met. USD rallies initially then sells off and chops while 1- to 3-month implied FX volatility craters.
3. Sector-specific tariffs as described in the WaPo article or something even weaker to the effect of: “If our allies don’t do X by Y date, we will tariff them.” USD sells off 3% right away and then keeps going.
Humming in the background are some other factors that are important but hard to care about when we’re just days from Day One policy news. We don’t have much longer to wait. The suspicion is that the 20th of January will be a day for celebration and chest thumping and policy news will come soon after, maybe the 21st or the 22nd.
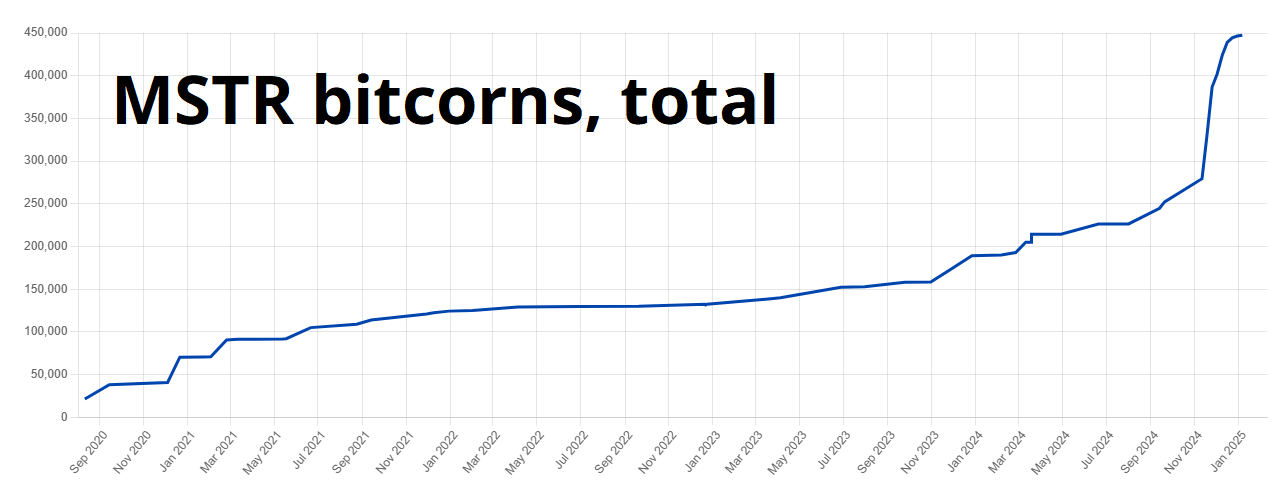
Bitcoin has been mostly 92k/102k for the past two months, and it’s getting a bit boring to watch. Saylor has just about doubled his stash since November, and while his buys caused a dramatic rally in November, they seem to be finding ETF sellers of late. Here’s Saylor’s blotter:
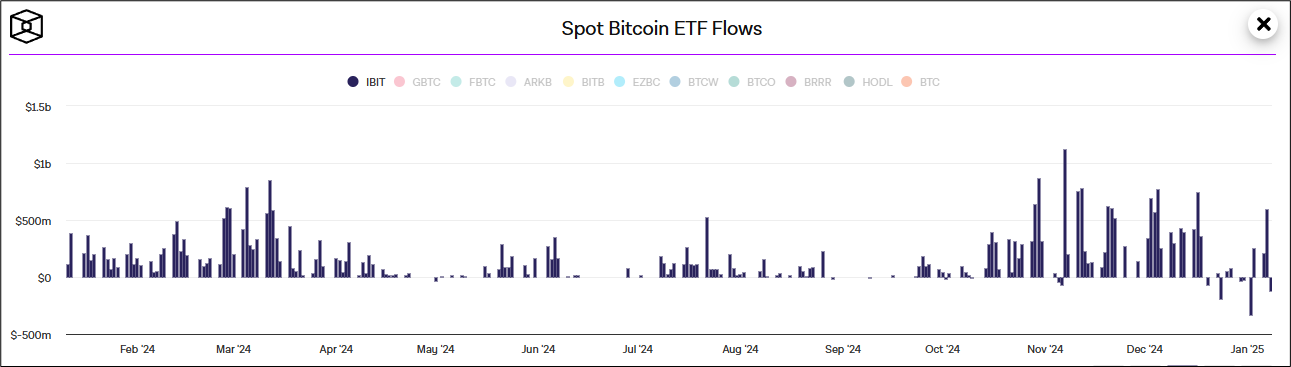
Meanwhile, here’s what the Boomers are doing.
Saylor has nearly infinite capacity to buy bitcoin as long as the MSTR premium is well above 1.0, so I’m not sure I would take a side here. You definitely don’t want to be short MSTR into the January 21 special shareholders meeting because a stock split will almost certainly come shortly after that (not investment advice).
You might hate it because it’s so nonsensical, but stock splits are bullish for meme stocks from the date of announcement until the split happens. So, if they meet on the 21st, approve the massive increase in stock outstanding allowed, and split that night or sometime that week—don’t be surprised!
Every time I write a snarky bit about commodities, they rip the next week. Particularly interesting this week is copper (which is apparently rallying as the market tries to buy US supplies before tariffs hit + possible demand for the LA rebuild).
To give you a sense of how idiosyncratic this move is in copper… Normally the Australian dollar (AUD) and copper trade up and down together because they’re both China proxies and Australia is a big exporter of commodities. On this next chart, the red line is Dr. Copper, and the black bars are AUD.
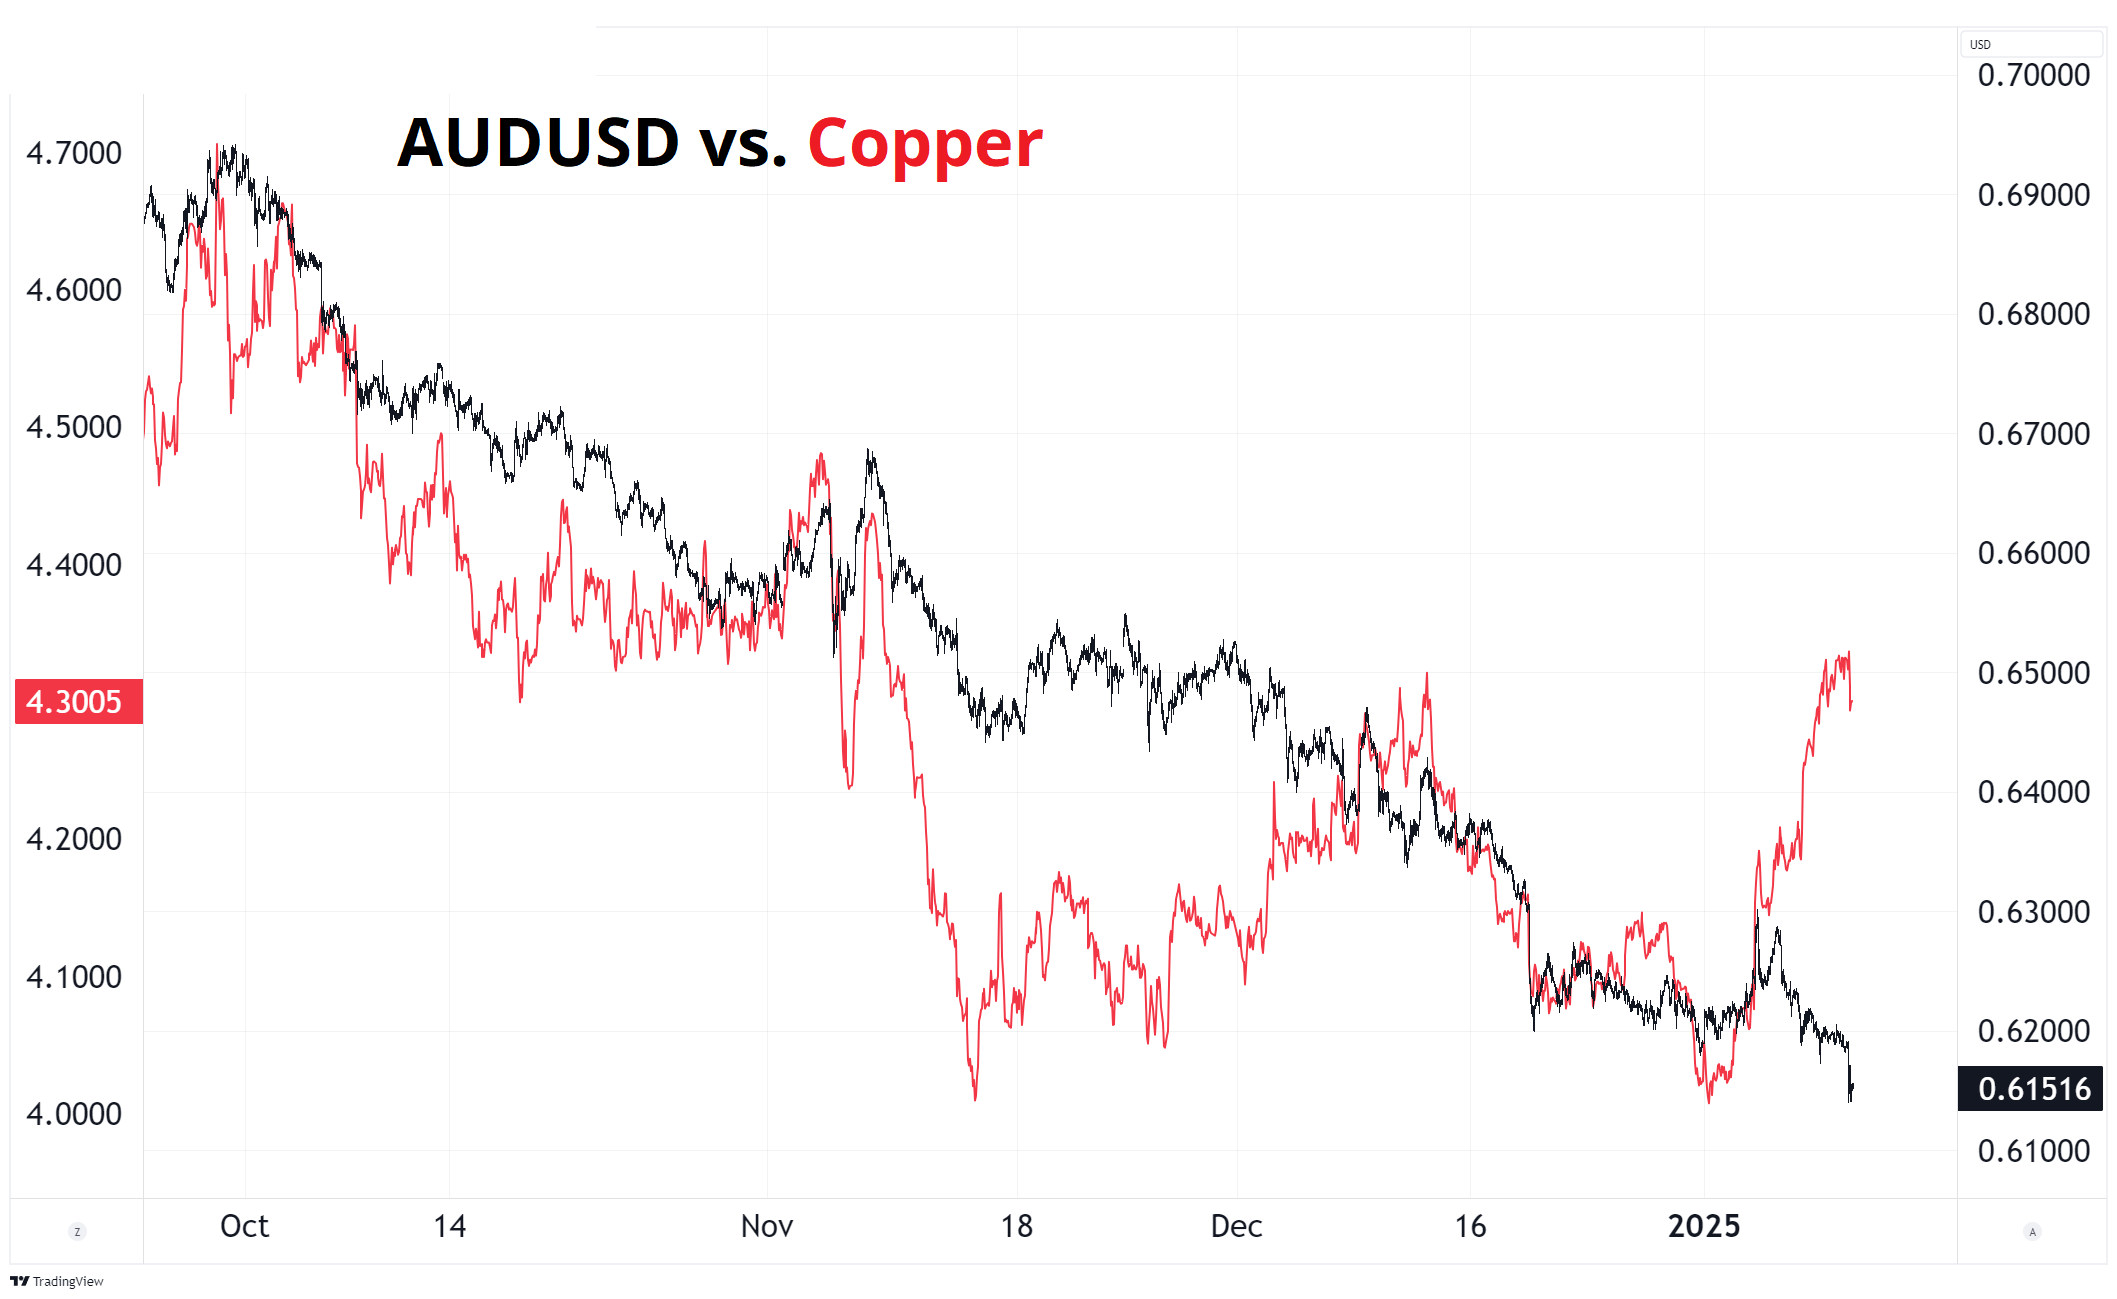
So even as the US dollar rips higher, China circles the toilet drain, and risky assets melt a bit: Copper strong. Definitely interesting.
Oil also had an excellent week and is now right back to the top of the range that has defined trade since last August. Mildly interesting.
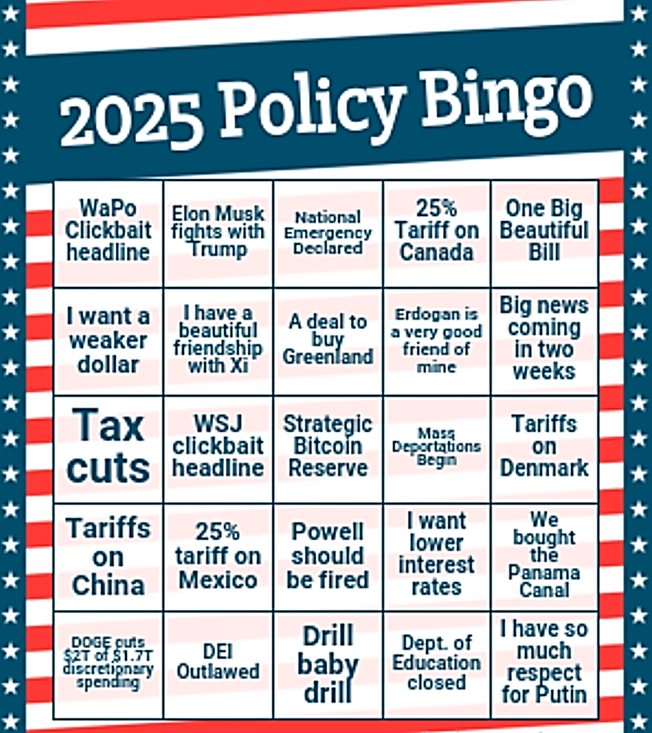
That’s it for this week. Here’s a bingo card I made.
Get rich or have fun trying.
If you like Nicki Minaj’s verse in Monster, or Doja Cat and Missy Elliott in general, you will like Doechii.
He doesn’t quite call this a bubble. But he really, really wants to!
Reality check on government spending cuts
Axios compares DOGE to the Grace Commission.
New podcast with Alf and I
Some weeks there’s not much going on. This week, we filled 35 minutes and could have filled 135. Lots of good topics discussed, IMO, though obviously MO is biased.
Thanks for reading the Friday Speedrun! Sign up for free to receive our global macro wrap-up every week.
