Seasonality is (sometimes) real
Seasonality can be controversial because some people think it’s just data mining or fooled by randomness and yet many discretionary traders and systematic funds profit from it year after year. There is nearly incontrovertible evidence that various forms of seasonality work out of sample; it always comes down to probabilities and not certainties. Speaking of seasonality:
The 2025 Spectra Markets Trader Handbook and Almanac is now available.
The good news is, this is the third seasonal almanac we have published and that gives us two years, and hundreds of trades worth of out of sample data to analyze. And the results are incredibly strong. So strong, I had to check the data a few times and ask Justin to cross-check some manually. Here are the statistics if you did every trade in the Almanac so far.
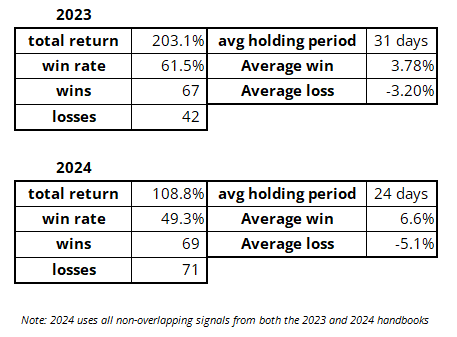
These trades are not vol-adjusted and there is no stop loss. They are simply “Enter when the seasonal says to enter and exit when the seasonal says to exit.” Therefore, there are many complexities involved when turning this into a real trading strategy. The point here is to show that the signals work, out of sample. And there are 100s of them.
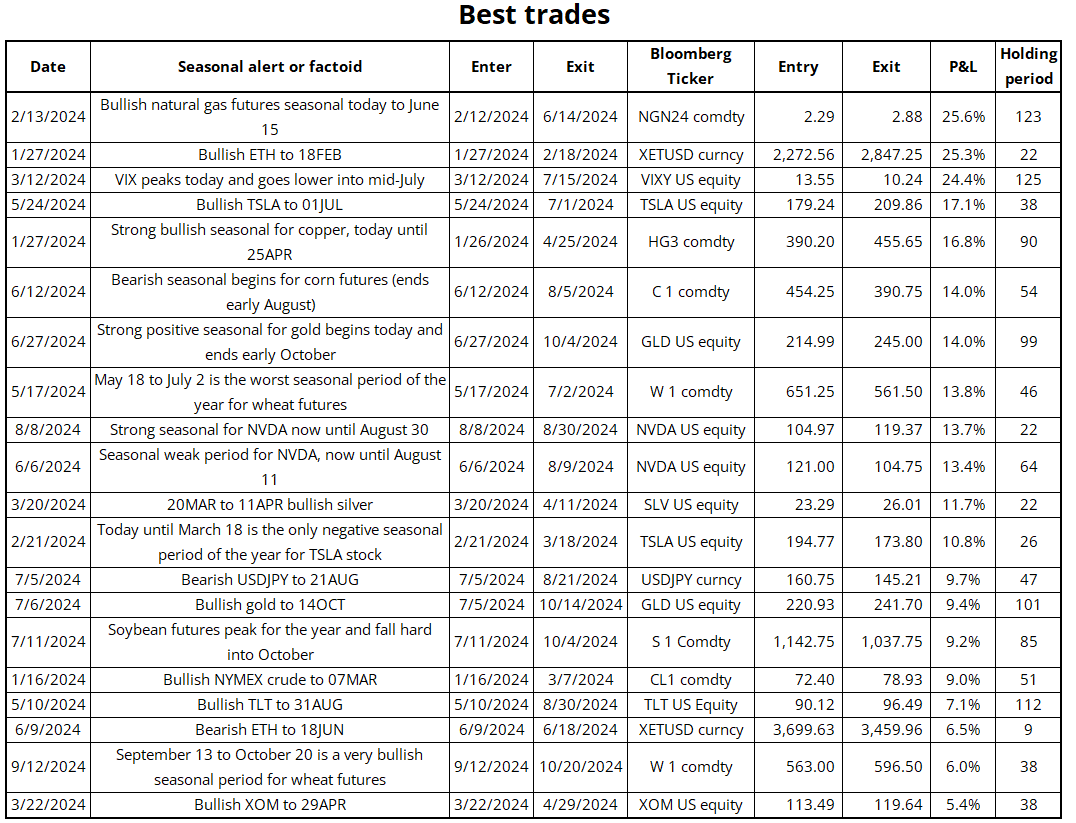
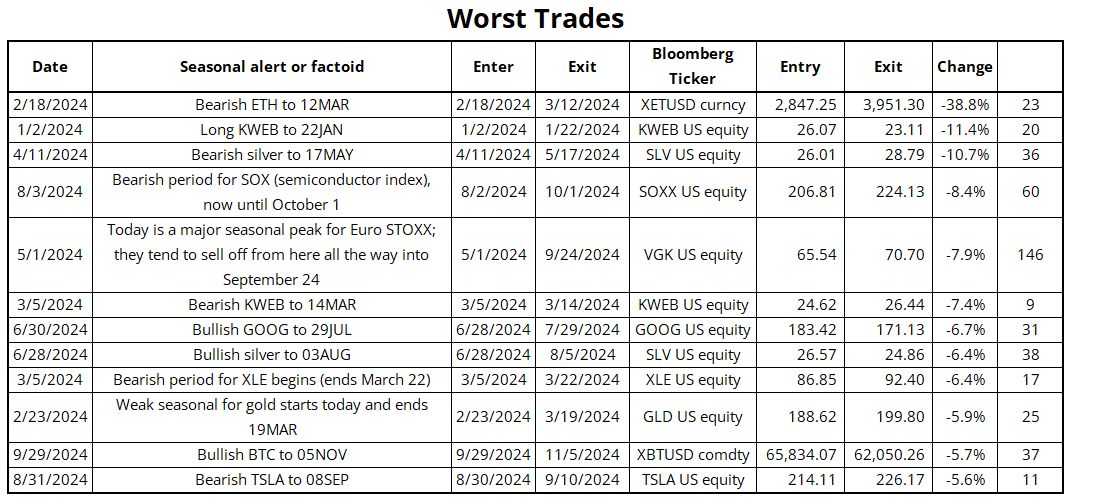
In 2023, the signals performed via a high hit rate and in 2024 it was more that the skew was tremendously favorable. But it’s not just one or two trades that drove the results. At the end of today’s piece, I provide an appendix showing all trades that made or lost 5% or more.
The timing of some of these signals was bonkers. For example:

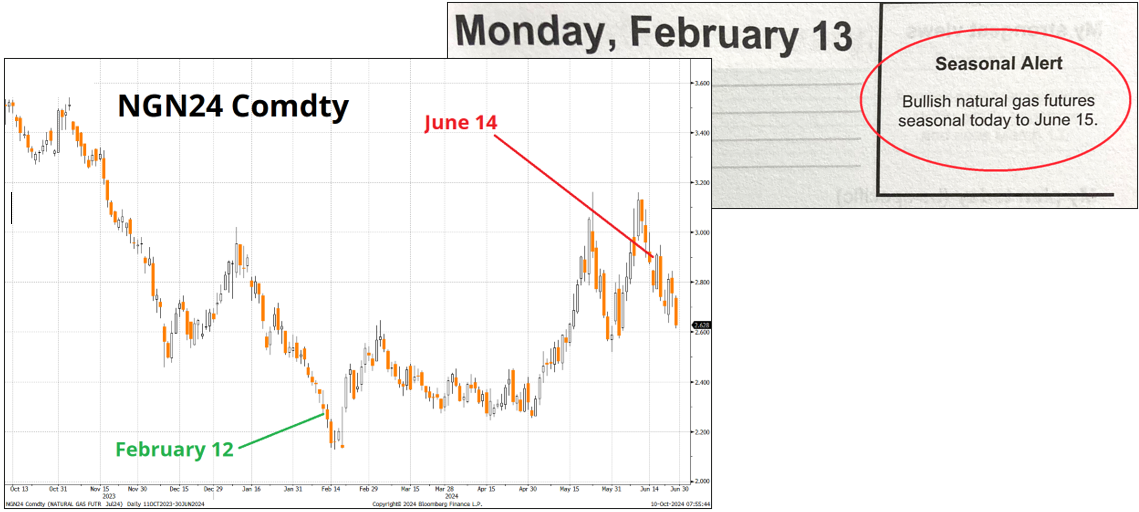
Obviously two cherry-picked examples mean nothing. But the sample size is now 249 trades and counting over almost two years. Again, I’m not saying that it’s easy to do these trades. There are risk management questions around all this that are beyond the scope of a Trader Handbook. How do you size the trades? Where do you put your stop? Does past performance guarantee future results? Etc.
But you are better equipped with knowledge of the important seasonal days, weeks, and months of the year for markets you trade. Seasonality is one of many critical inputs into a holistic trading framework. The handbook covers all major markets, including commodities, crypto, single names, and FX.
For more on why I believe that there are predictable seasonal patterns in markets, and how to understand that they are probabilistic, not deterministic, check out this piece: Seasonality is Real. One last thing: In 2023 people said the handbook was too big. In 2024 I thought it was too small. So, this year, we went in the middle and I think it’s by far the best format of the three. It’s a nice book.
You can buy the Trader Handbook and Almanac on Amazon now. Click on “Read Sample” (on the left side below the cover image) and scroll through to see the inside of the book.
Vol bump
Yesterday I said that it was unusual to see a bump up in MOVE and VIX without a concomitant drop in equities. I failed to account for the fact that some portion of the bump higher in volatility is simply the fact that 1-month vol now incorporates the election. Here is how the election roll affected various 1-month vols in prior elections.
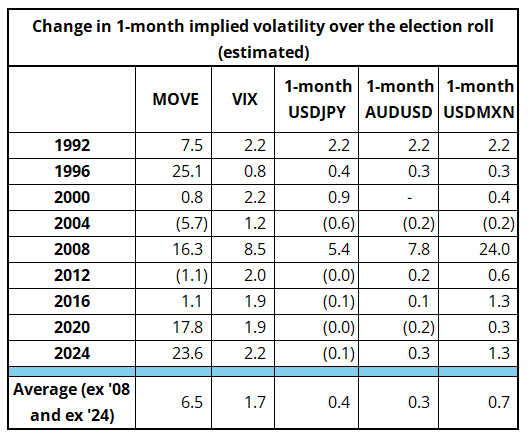
Note that 2008 is a huge outlier because the election roll happened the week of the largest-ever decline in the Dow. That week was one of the most epic weeks ever in financial markets as the TARP passed, $700B of taxpayer funds were allocated to purchase assets from failing financial institutions and the market deemed the response insufficient. This week marks the 16th anniversary of that market wreckage. The Dow closed at 8451 that week and went on to make a low of 6469 a few months later.

Fun fact: On October 8, 2008, USDMXN opened at 12.10, traded to a high of 14.29, and closed at 12.32. The P&L on 7 mio USDMXN low to high to low was $2,264,000. The P&L on 7 mio USDMXN over an average daily range today is $78,000.
Final Thoughts
The Trump trades (buy USDCNH, sell EURUSD, sell bonds, buy Mag7) are all perky as the turn in market momentum from NFP has now received a boost from what appears to possibly be rising odds of DJT.
Sure, the significant and difficult-to-arbitrage gap between Polymarket (an offshore, crypto-based betting platform funded by a Trump ally) and Kalshi (a US-only betting platform) has raised some eyebrows. But as we enter the home stretch, it looks like financial markets are boosting the Trump premium a tad, too.
Finally, nobody talks about Supercore CPI anymore, but keep an eye on it. Up 0.4% in September.
And finally, finally: The MSTR story is interesting right now as the premium to BTC is blowing out to the topside. Short interest doesn’t really explain it anymore (it was >40% now <15%). Gamma may be a factor.
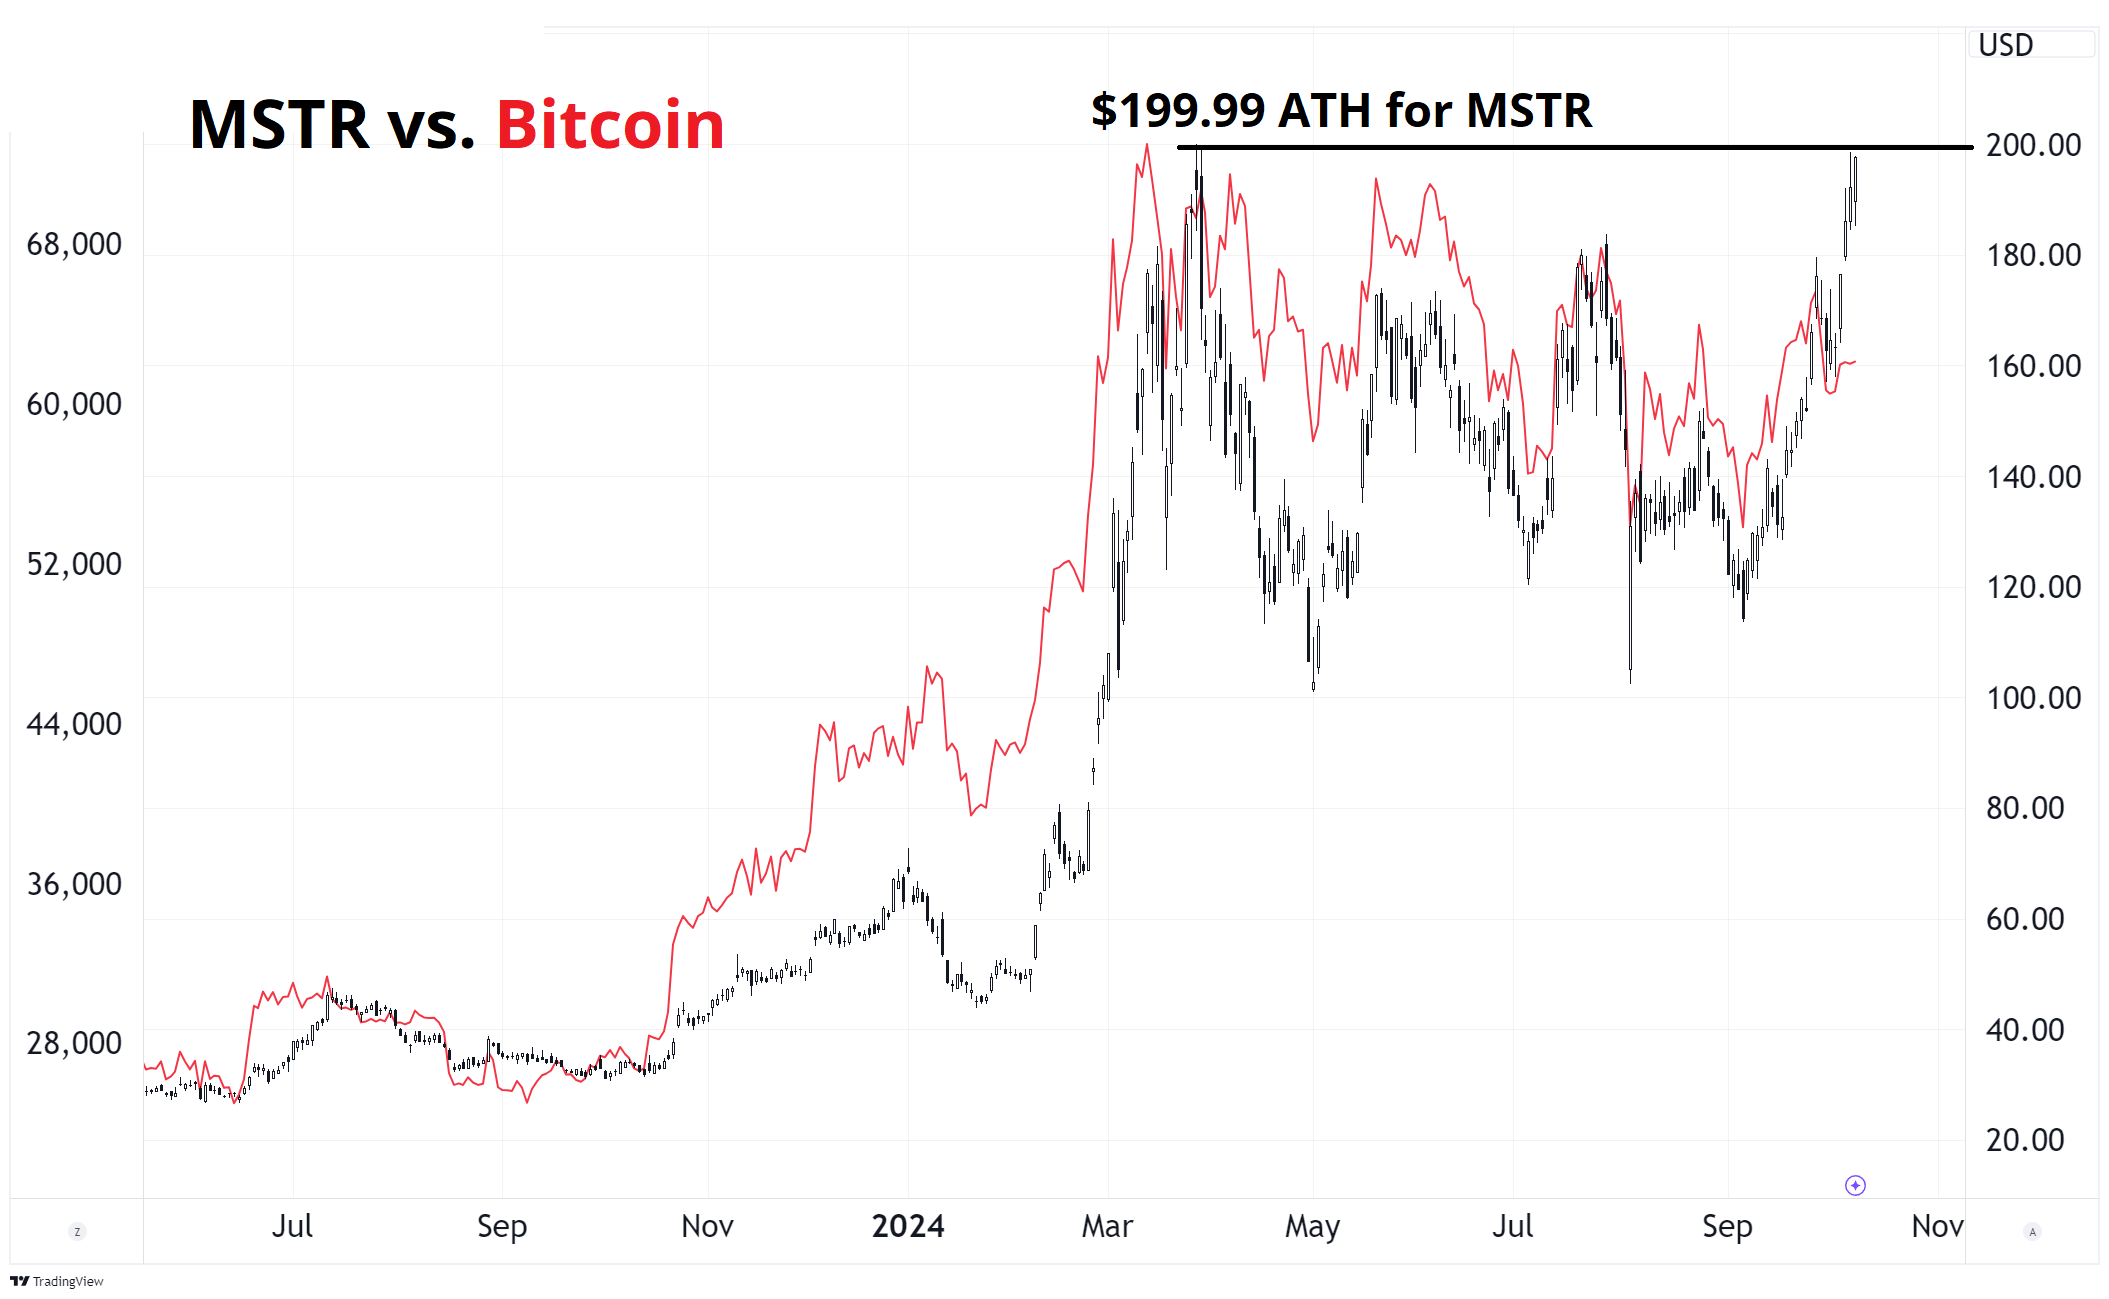
You can do more complex analysis of the MSTR premium (this chart is a simple heuristic that doesn’t tell the full story of the MSTR BTC value vs. debt vs. shares outstanding etc.) but this is a good enough, simple visual. Note the double top at the ATH $199.99.
Have a beautifully colorful day.
APPENDIX: The best and worst Trader Handbook trades of 2024, so far