Rabbit Hole #8
Seasonality is Real
Sometimes.
Welcome to Rabbit Hole #8. The Rabbit Hole series offers deep dives into random trading and macro topics that fascinate me. Today’s note is on the empirical and verifiable realness of seasonality in market prices and why it sometimes gets a bad rap from the more statistically minded.
“Seasonality is bullsh*t.”
“Seasonality is just your imagination.”
“Apophenia, dude.”
“There is no statistical significance to your observations. Your sample size is too small.”
These are four rebuttals I get when I write about seasonal patterns in market data. And there is reason to be skeptical of seasonality. If you torture enough daily, weekly, and monthly data in enough currencies or asset classes… Some of it is going to confess, even if there is no rhyme or reason for the patterns that pop out.
As such, I’m not a huge fan of datamining or going out looking for seasonality. If you look hard enough… You will DEFINITELY find some seasonality in your data simply because seemingly meaningful patterns will always emerge from data if your data set is large enough.
On the other hand, I have observed seasonality firsthand from my market making seat and it is anything but random. It is anything but bullsh*t. It’s 100% real.
There are many examples of this sort of observable seasonality, and they generally are situations where flows depend on the calendar for one reason or another. When you can observe or measure the seasonality of the flow, and that seasonal pattern matches the seasonal pattern of the price, you’re onto something. And if you can observe such patterns, say, 10 years ago, and they continue to work to this day, out of sample… Even better.
One example of this sort of seasonality in FX is the tendency for large US corporations to buy USD to hedge global revenues on the third last business day of each month. This is called “Corporate Month End” or “t minus 2”. “t”, in this case, represents the last day of the month.
Spot currency trades are value t + 2 so if you want to do a currency trade that settles on the last day of the month, the simplest way to do that is to trade t – 2. Many US corporations are natural USD buyers and for simplicity, they hedge each month or each quarter on t – 2. This might sound unsophisticated, but they know they are in the pharmaceutical or information technology business or whatever, not the FX speculation business.
So, they hedge monotonically as revenue comes in. But it would be expensive and annoying to hedge every day, so they either do it once/month or once/quarter.
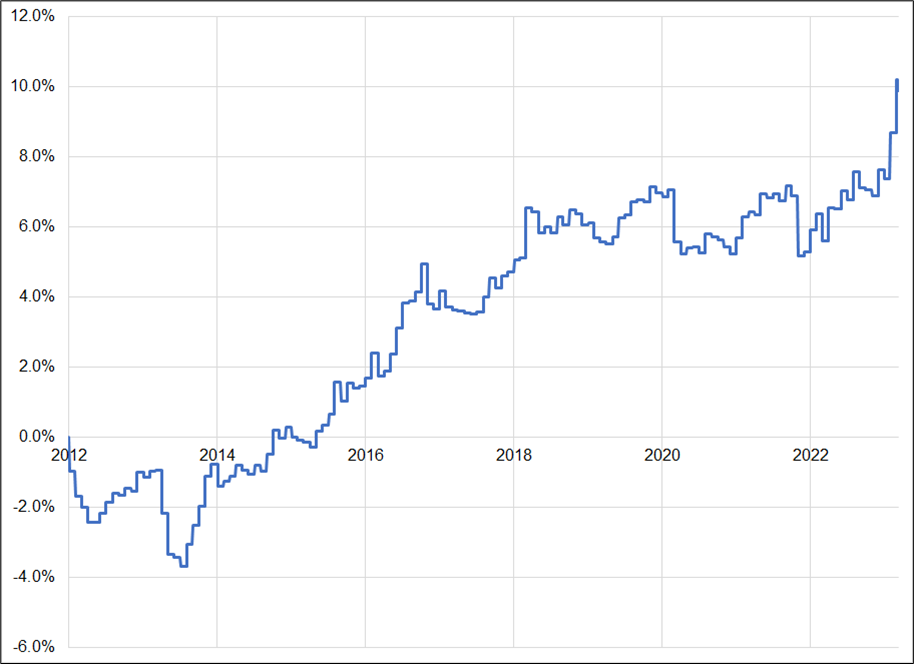
The two currencies I’ve seen transacted most on t – 2 over the years are USDJPY and GBPUSD. Here is the performance of long USDJPY on t – 2, back to when people first started talking about the effect (and I started noticing corporate activity spiking) in 2012.
USDJPY on t – 2 back to 2012
And here’s the same thing for GBPUSD.
GBPUSD on t – 2 back to 2012
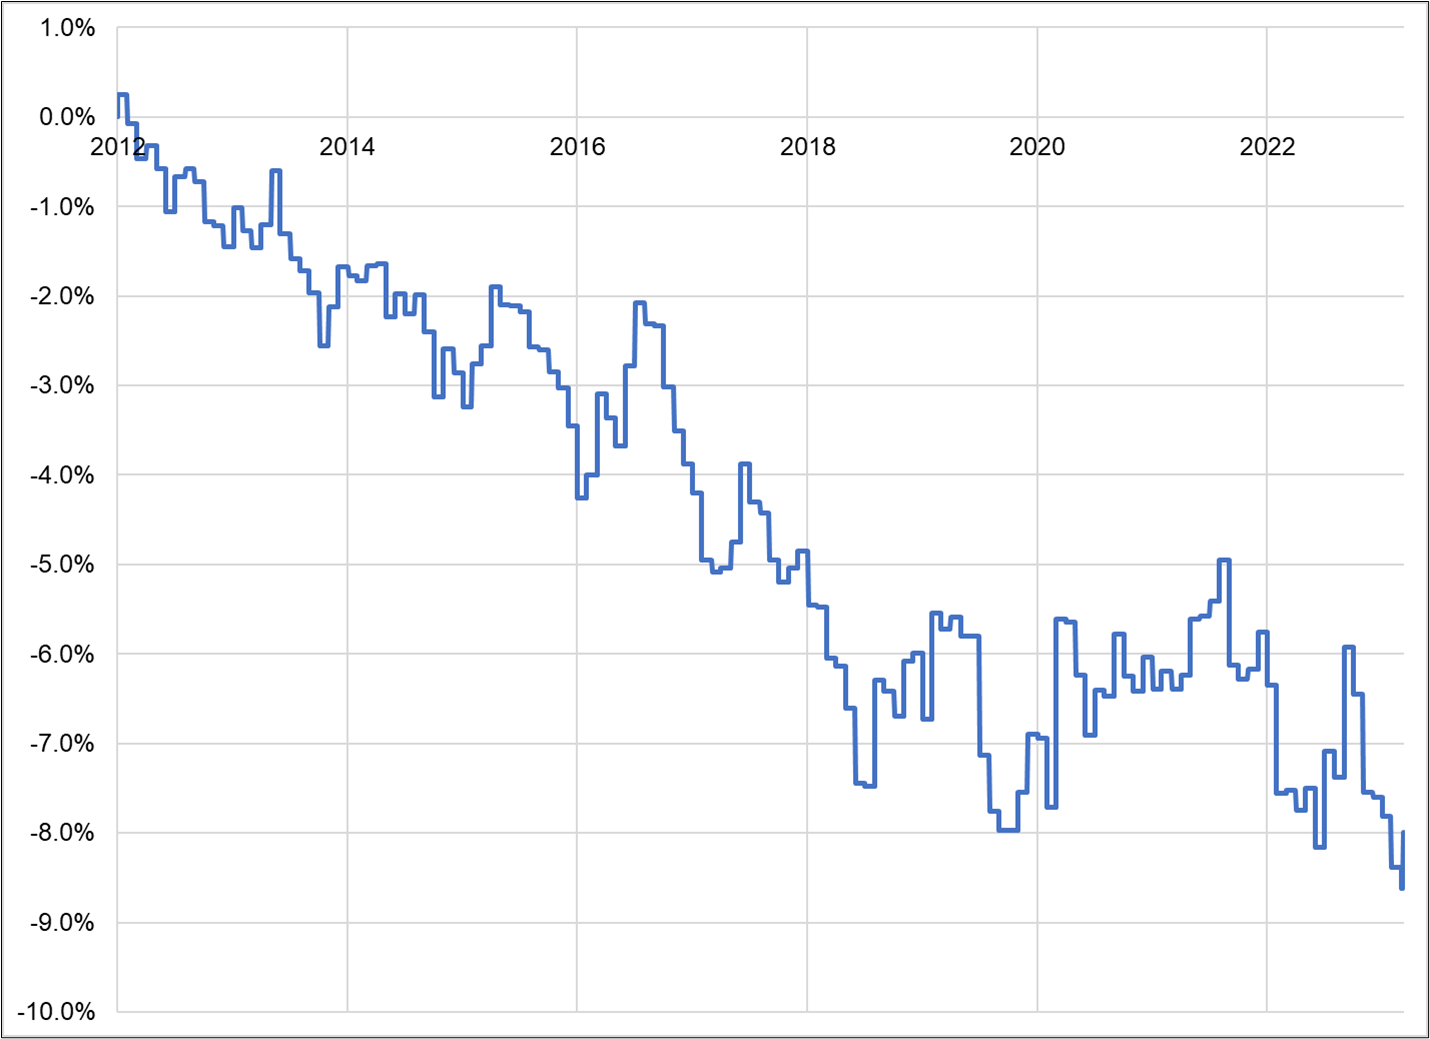
The historical odds of GBPUSD going up or down on any random day are very close to 50/50. On t – 2, GBPUSD only goes up 37% of the time. USDJPY’s up/down ratio is 54/46 on t – 2 and 51/49 on all other days. The effect is persistent and does not relate to the trend in the currency pair. For example, GBPUSD is higher now than it was on January 2017, yet the trend on t – 2 remains selling GBPUSD. Same story in EURUSD, AUDUSD, and USDCHF. t – 2 has a significantly higher probability of USD up than all other days.
More evidence appears if you look at USDCAD, because it is a weird one in that it does not settle t + 2, it settles t + 1. Therefore, one would expect there to be no effect when observing USDCAD on t – 2 (other than perhaps some sympathy as the market buys USD against other pairs).
As hypothesized, USDCAD is random on t – 2; there is no USD buying effect. USDCAD is 50/50 on t – 2, in contrast to the currencies that settle t + 2.
USDCAD on t – 2 back to 2012
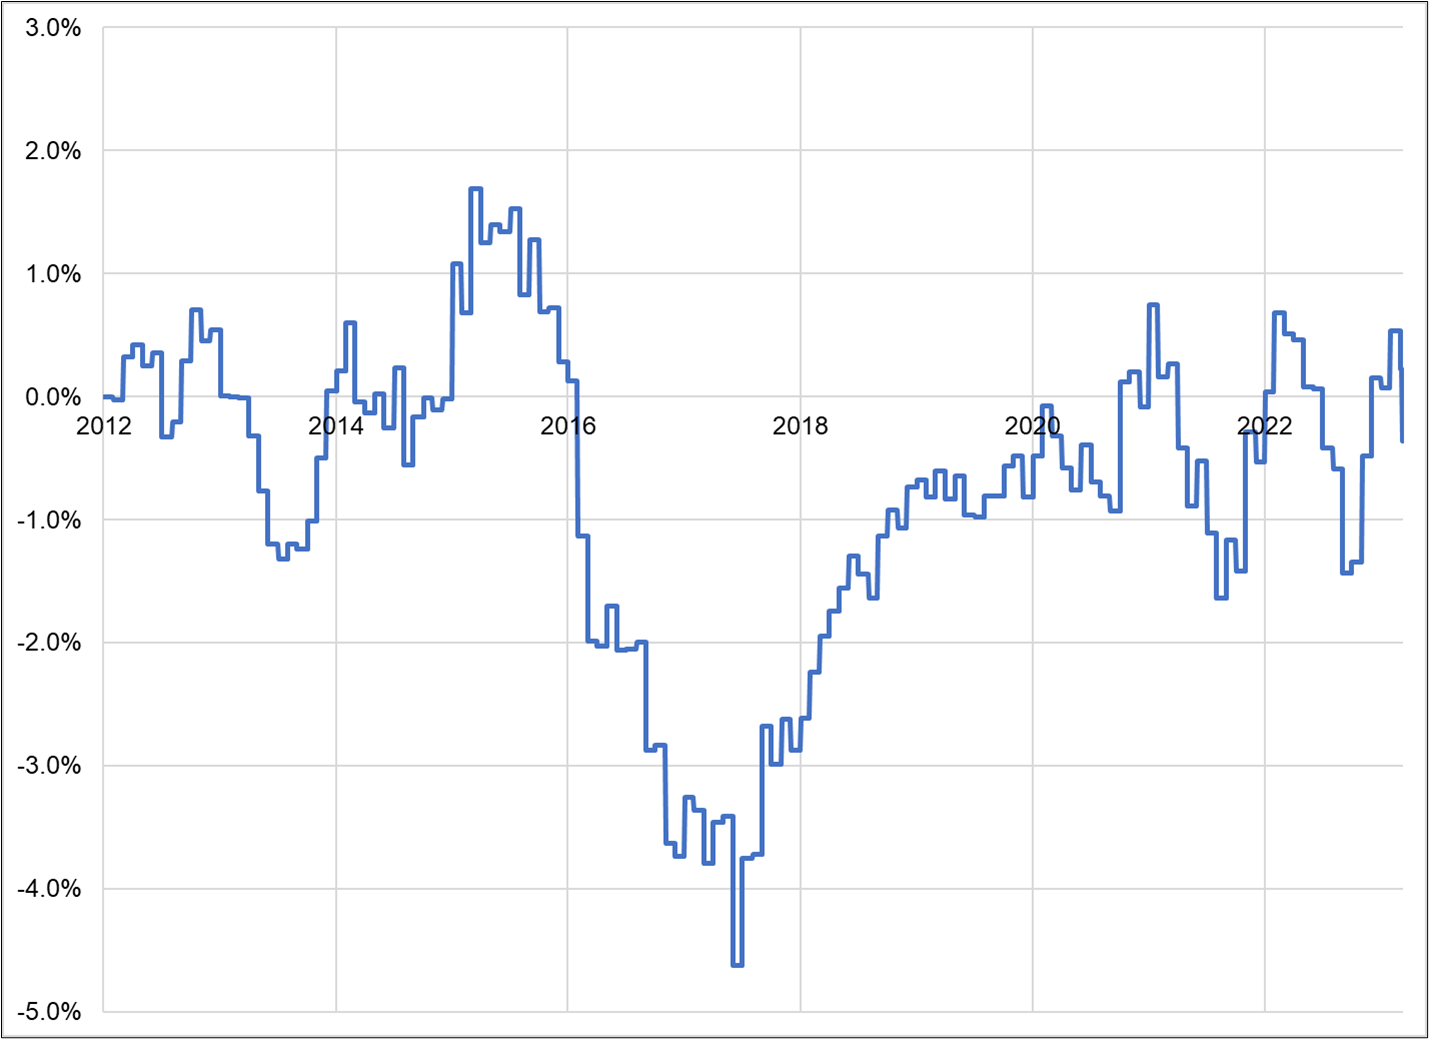
This is a good example of logical, observable seasonality of price that reflects seasonality of flow. It’s important to note that seasonality doesn’t work every time and we should not expect it to! There could be economic data, large moves in risky assets, or other events and circumstances impacting FX on t – 2. Seasonality is a probabilistic framework that tells you an asset is more likely to move one way or the other. No guarantees!
Another seasonal pattern in FX is USDJPY around Japanese fiscal year end. Japan’s fiscal year ends on March 31. This pattern has been known for years, yet it continues to work out of sample. Again, I have seen these flows. I worked at a Japanese bank and at banks that serviced Japanese customers. The big funds in Japan buy foreign assets and sell JPY around fiscal year end and do large portfolio window dressing right at the turn of the fiscal year.
If you pick any 8-day period at random in USDJPY, the odds of USDJPY going higher are 50/50. If you look only at that window around fiscal year end, USDJPY went up 12 out of 16 times (75%). If you discovered this effect randomly, it would sound like fitted parameter selection or datamining, but if you see something happening in real life, then verify it with the data, that (to me) is a completely different result. The sample size is small, but the data supports a real-life observation and thus I believe the bar for significance is lower.
Here is the P&L of long USDJPY only from March 27 to April 5 every year.
USDJPY long from March 27 to April 5 every year
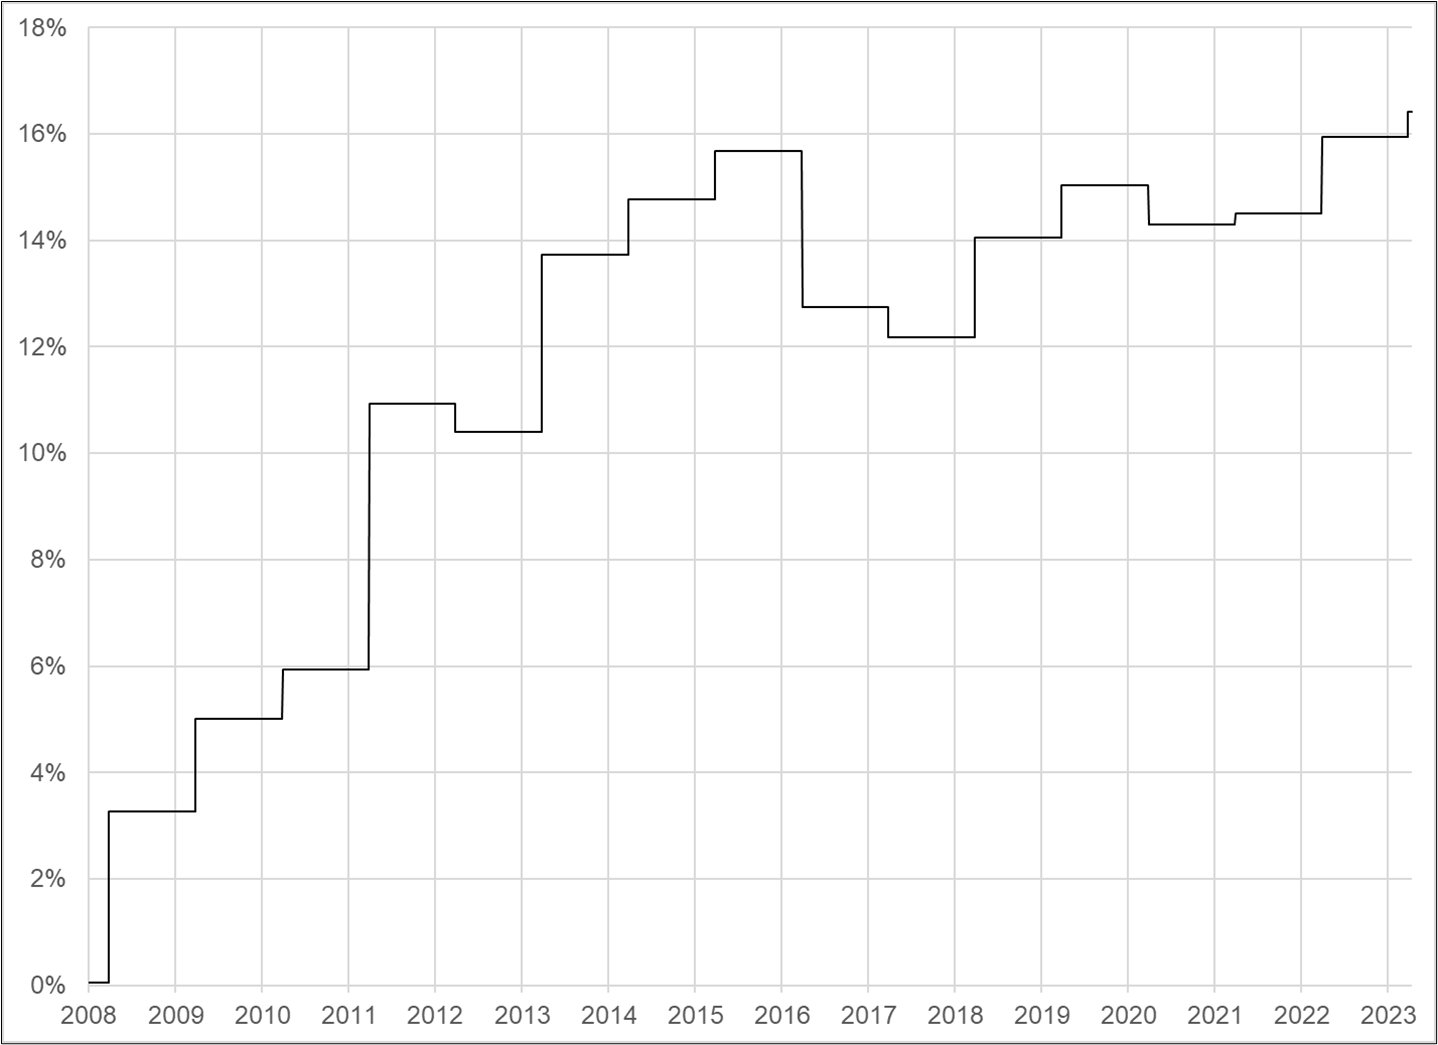
Again, it doesn’t work every time. Obviously. This is the difference between seeing a data set that shows a tennis player hit 12 of 16 good first serves for a 75% first serve success rate. That data on its own probably doesn’t tell you much. But if you are watching the player and she shows evidence of excellent form and identical, repeatable mechanics, you probably trust the data more. Since I have seen the flows that create the seasonality, I am pretty much certain it’s not the product of complete randomness.
If you zoom in on the Tokyo Fix on the last day of the fiscal year, you see some more micro evidence of window dressing. USDJPY tends to explode higher right into 9:55 a.m. Tokyo on March 31. Pretty much every year (including 2023).
Will these observed behaviors and patterns continue forever? No. Are they more than the product of snooping around in the data? Yes. The seasonality I am describing here is more like a scientist making observations, coming up with a rational hypothesis, then using data to confirm or disprove the hypothesis. The more data, the better, of course.
Stocks
I have never been a market maker in stocks, so here I have to take a different approach. I have read a ton of the research and there is much support in the academic literature for persistent seasonal effects in equities. For example, the Halloween Effect (aka Sell in May and Go Away) was discovered in the 1970s and has worked very well out of sample since then. But if I can’t find an explanation for it, I’m just not going to believe that it will persist. Also, I’m not a huge fan of waving around academic studies because many of them can’t be replicated and many don’t work out of sample even if they’re methodologically sound.
Fortunately, in equities, there is plenty of flow data available. And even before you look at the flow data, you can sit down and fairly easily come up with a good guess on the timing of major equity flows. Other than wages and salaries, here are the major cashflows (in and out) that impact households during the year.
January/mid-February
- Year-end bonuses ($100B+) + new allocations to retirement accounts
mid-Feb to mid-March
Mid-March to early May
- Tax refunds (total $250B+)
May to August
- Peak home buying season (money out of stocks to make down payments)
August/September
- Tuition payments ($600B+) trigger withdrawals from the stock market
October/November
December
- Christmas gifts and bonuses
I’m not just trying to find cashflows to match the seasonality of the stock market! This is just how money flows through households, generally. And this leads to a pattern of flows that looks like this:
Retail flows are strongest in January and April
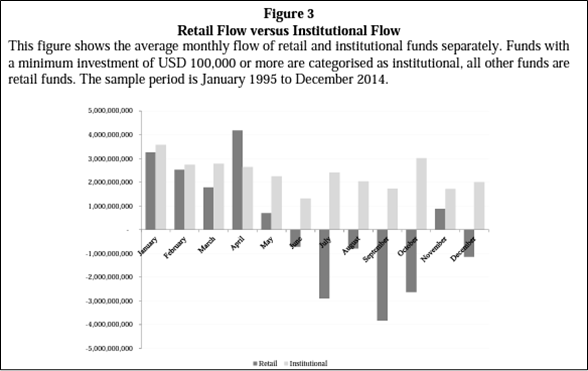
Flows are by far the strongest in April. And April is the best-performing month for stocks. Coincidence? Maybe. The worst months for stocks are when everyone is pulling money out of education savings plans to fork out billions in tuition. Coincidence? Maybe.
Median performance of equities, by month back to 1990
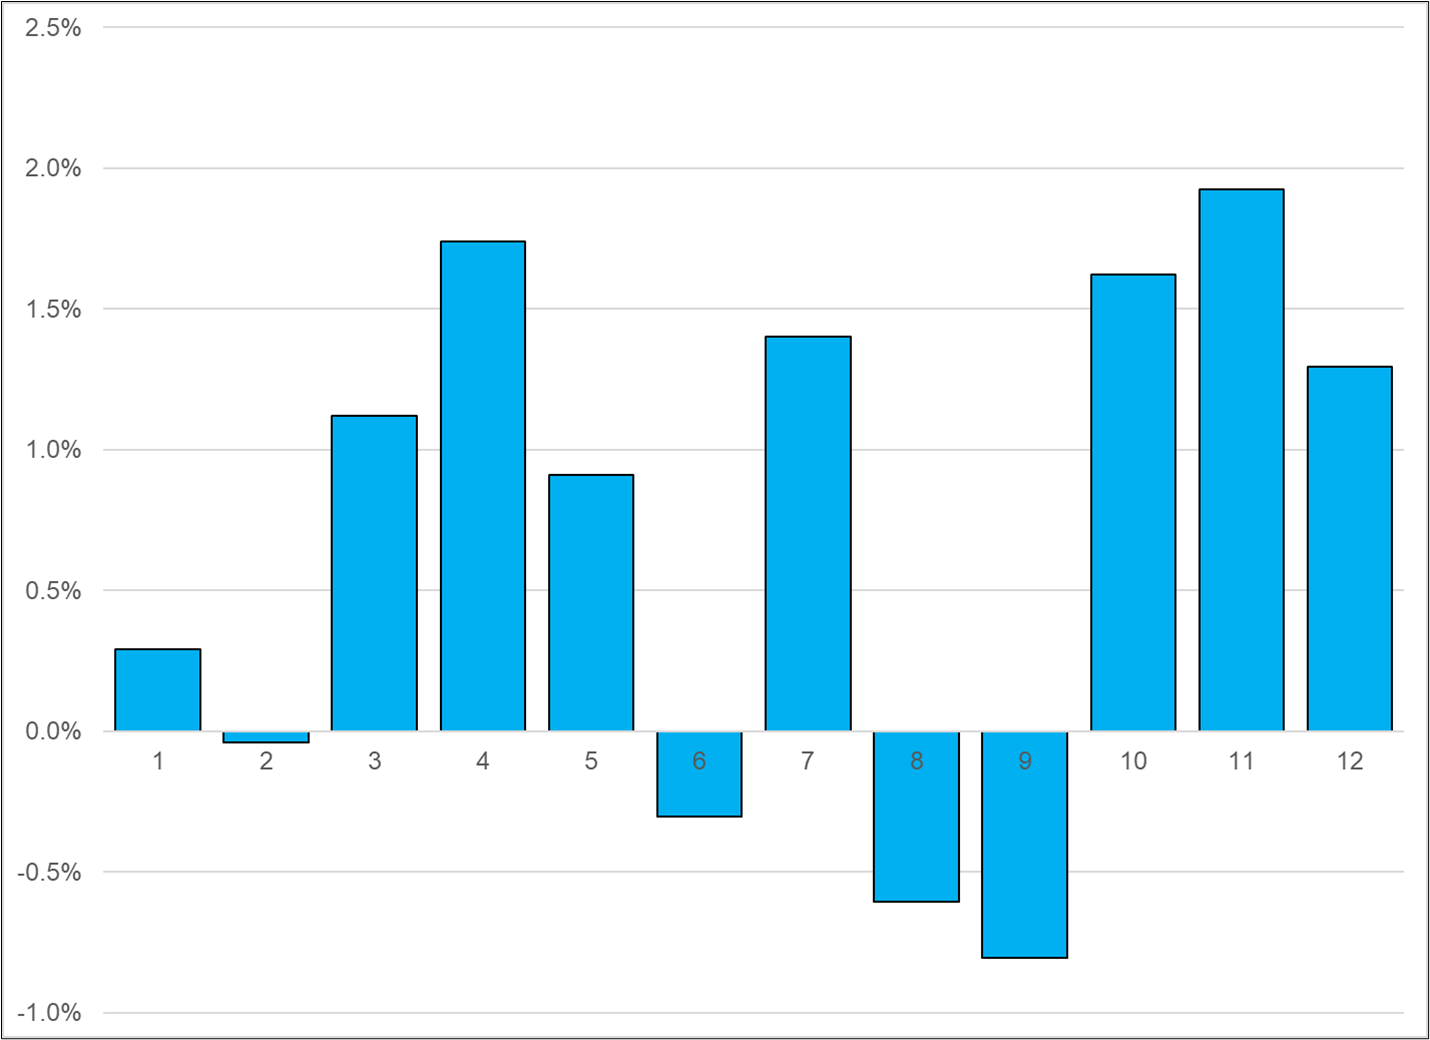
I don’t know why this is the case, but April and July are the biggest months for US tax refunds. April makes sense but July is weird. Anyway, that could help explain July strength.
Do the flows match the price perfectly? No. We should not expect them to. Do they match enough that maybe you’ve got a logical explanation for equity seasonality? I think so. The timing of household cashflows matches the seasonality of equities very well.
If the flows matter on a month-to-month basis, they should matter even more on any given day. There is so much that goes on in any given month, economic data, political news, etc. But on any given day, huge flows, if they appear, are more likely to dominate price.
In the USA, people get paid on the 1st, 15th, or end of the month. Some portion of that money gets automatically invested into 401Ks (US retirement accounts). As such, if flows matter, you would expect stocks would do better around the start, middle and end of the month. Here is the data:
Average cumulative performance of the S&P 500 over the course of each month (data back to 2000)
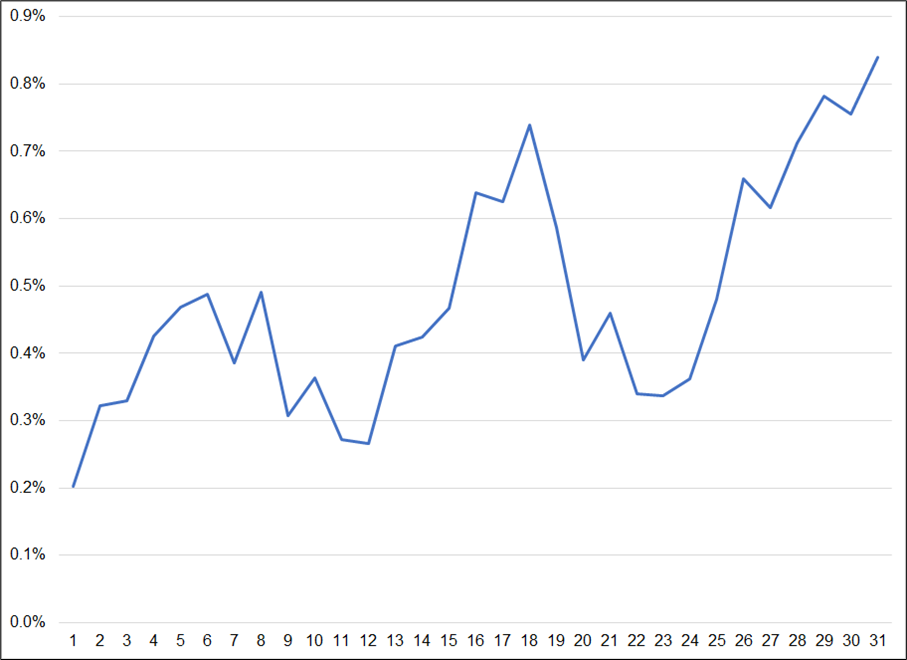
Once again, the data matches the hypothesis. Flows matter!
Apophenia
Humans are designed to see patterns. It’s how our biology works. It allows us to simplify and process a complex world.
It is called apophenia: The human tendency to perceive meaningful patterns within random data….
Just a simple faucet, right??

So, we always need to be extremely careful when we think we see a pattern. It might be real, or it might be our dumb, creative human brain at work.
Critics of seasonality make many valid points. Seasonality is subject to confirmation bias. It can be the product of biased sampling and overfitting. It can be the product of data mining. Sample sizes are often too small to have statistical validity.
On the other hand, a logical, well-selected hypothesis supported by data can often reveal underlying flows in a market and those flows may exhibit persistent seasonality.
Conclusion
Seasonality appears in market data on various fractals and there is money to be made by incorporating seasonality into your process. If you can explain a seasonal price irregularity using logic, or you can explain it with flows you are seeing as a market maker, there is a strong possibility that the seasonality is not random. If you datamine like a banshee and come up with all sorts of hard-to-explain seasonals, you are probably gonna be fooled by randomness.
Think of seasonality as one of many inputs into a probabilistic trading process. Seasonality will rarely take you all the way to shore, but it will help you assess the prevailing winds and get you tacking in the right direction. Don’t overestimate the importance of seasonality, but don’t ignore it either.
Have a beautifully geometric day.


