The hike is priced now what ?
Fun fact: I can rap all of Ice Ice Baby from memory

The hike is priced now what ?
Fun fact: I can rap all of Ice Ice Baby from memory
Hello. It’s Friday. Thanks for signing up. I’m Brent Donnelly.
The About Page for Friday Speedrun is here.
Here’s what you need to know about markets and macro this week
The market has spent the last two weeks pricing in the CPI and PPI data and at this point I think it’s fair to say that there has been a complete shift in sentiment and positioning. Most of my chats are now talking about a higher dollar and reasons to pay rates—a complete turnaround from where we sat pre war. The central bank rhetoric is necessarily following close behind because they look at the same stuff we do.
Much of what I wrote in am/FX this week is relevant to this week’s Friday Speedrun. Portions cribbed from my daily notes this week are in a different font, starting in the next paragraph. If you are a regular am/FX reader, you can skip the bits in IBM Plex Serif. Like this…
People sometimes chuckle at the chart that shows how Fed Funds follows 2-year yields most of the time. They imply that the Fed is just watching the market and doing whatever it says. In reality, it’s more that bonds trade every day, but the FOMC doesn’t meet every day. Yields react to every data point while the Fed has substantial inertia. Bond traders can try on a position and get out if it doesn’t work while the Fed has high switching costs.
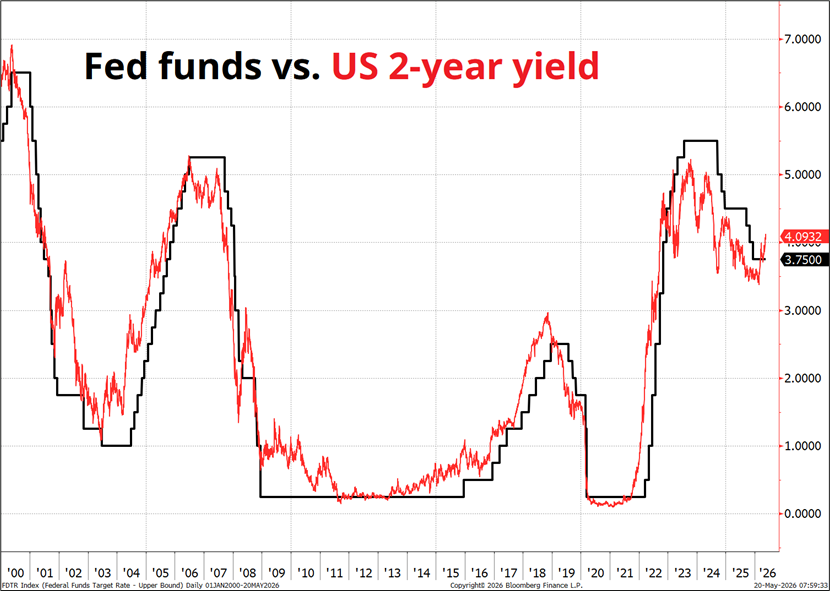
Given this lead/lag relationship and the constraints faced by the Fed but not the bond market, it stands to reason that the difference between the current 2-year yield and the Fed Funds rate should predict future changes in Fed policy. This is not a genius insight. But it is true.
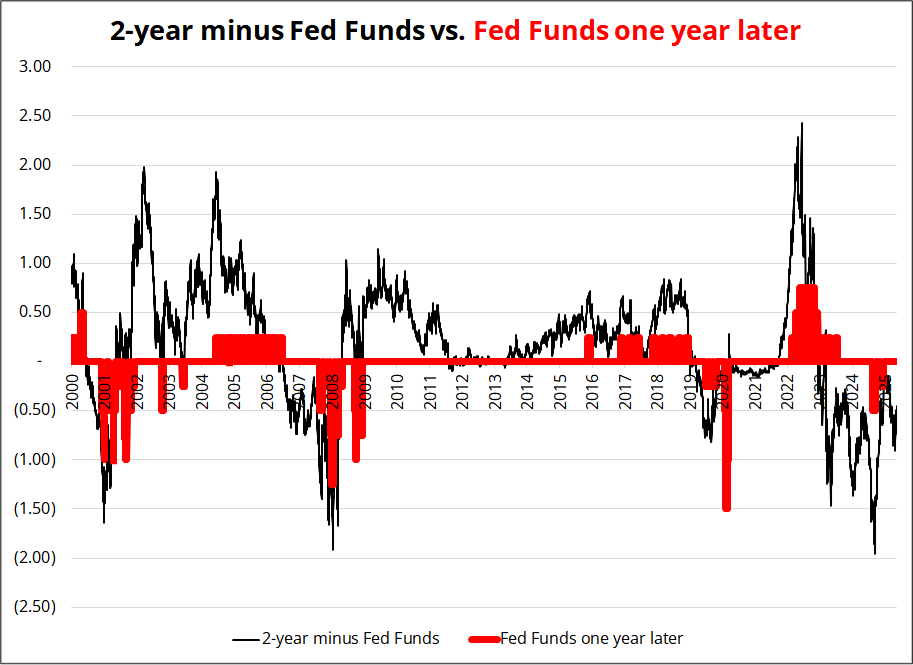
Here I plot the current difference between the 2-year yield and Fed Funds and look at where Fed Funds are two years, one year, six months, and one month later. You can see that the market is pretty good at predicting / driving the Fed. There’s quite a lot of reflexivity. Note that the top left quadrant (cuts priced, hikes happened) is basically a zero. The Fed almost never refuses the opportunity to cut rates. But they really hate hiking.
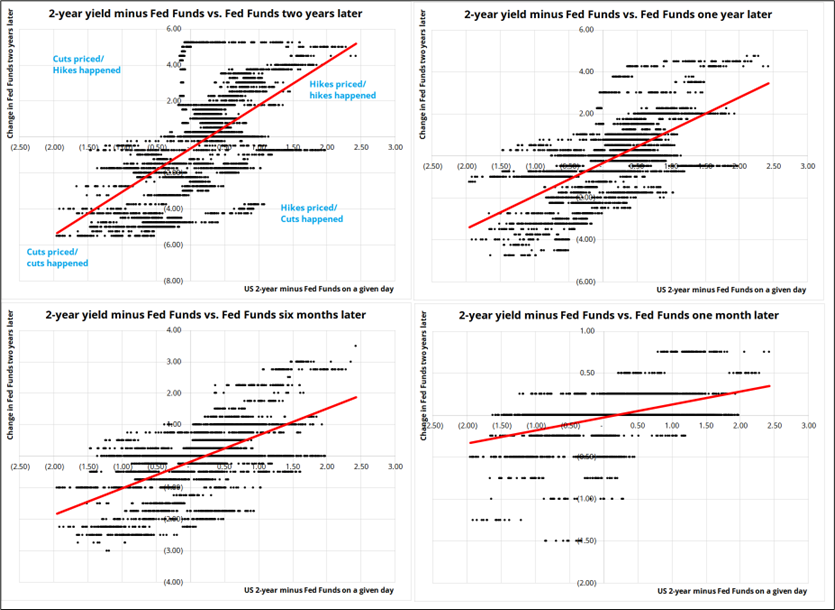
In case you are curious, I have included the full data series below. You can see a few of the crazy moments where rate hikes were priced in, but the Fed actually cut. May 2008 is particularly mind blowing. At that time, the world was spinning towards a Global Financial Crisis and yet the market expected the Fed to hike 100 bps in the coming year due to rising inflation triggered by the Peak Oil panic and the “commodities as an asset class” inflation boom.
I realize that it’s not revolutionary to say that 2-year yields predict Fed Funds two years out, but I do think the lead/lag process is useful to think about. It takes the sting out of a somewhat hawkish Waller as the market is already way ahead of him.
Elsewhere, the war continues to drag on with nothing good happening but also nothing bad happening. The ceasefire is intact despite some random Iraqi shenanigans. Oil is in a range since March, and the market has a hard time processing what any of it means because all the prognostications of supply shock doom have failed to materialize. Morgan Housel’s hilarious view of market forecasters is:
“The most common market take can be described as ‘person who didn’t see this coming is now 100% confident about what happens next.’”
But right now, even the people who didn’t see it coming and were 100% confident about what came next are admitting they have no clue. Hormuz closing was the worst case scenario and the real economy damage so far has been negligible. Could be a matter of timing or could be that the predictions are just wrong and capitalism has found a way once again.
Here’s how I see the current state of macro:
This all makes me think that one or two hikes from the Fed are not the end of the world, even if they happen. The path of inflation from here is critical as we see if there are second-round effects and whether the AI Capex bonanza feeds through to goods prices via computers, chips, copper, power, and whatever as the ongoing shortage of compute interacts with a shortage of oil and possible second-round effects as COVID is still not that long ago.
Next week we get Core PCE, where some of those computery inflationary elements could show up due to its different composition vs. CPI. Also, RBNZ could be an opportunity to make money as I continue to believe New Zealand rates pricing is bonkers.
There was a brief selloff in stocks this week as the post-expiry window is often a bit of an air pocket as the price-insensitive short gamma folks go back in their holes for a few days.
My tactical bear view on small caps worked out nicely and I am again a tad bullish stocks at this point. I suppose my view for the next few months is a low-vol grinding higher stock market where long carry is good and long vol is not.
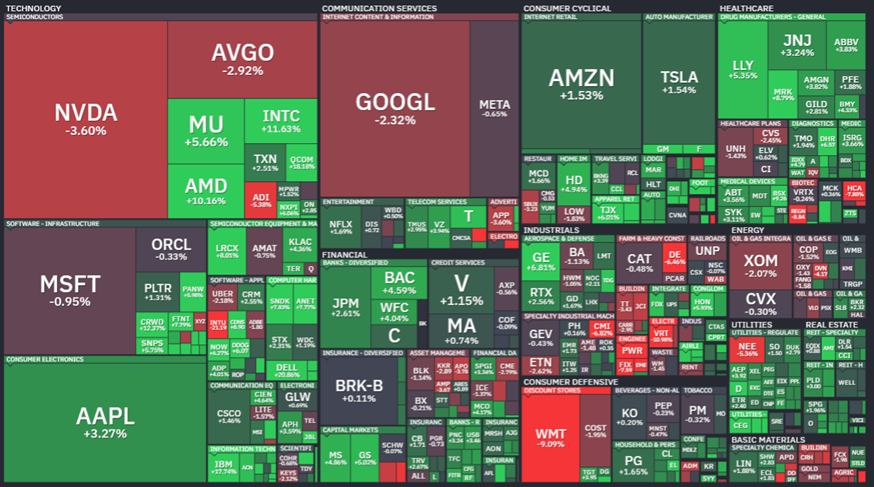
NVDA earnings were a bore this week as the market doesn’t really care about the actual or expected earnings releases anymore for whatever reason. Maybe the market cap of the stock is too large for punters to move it around and so the vol realizes below expectations and it chops.
Breadth worriers can breathe a sigh of relief this week as some of the big boys struggled and the rest of the market shrugged and ripped higher.
Positioning in semis and energy is on the extreme side. Here’s a chart from GS:
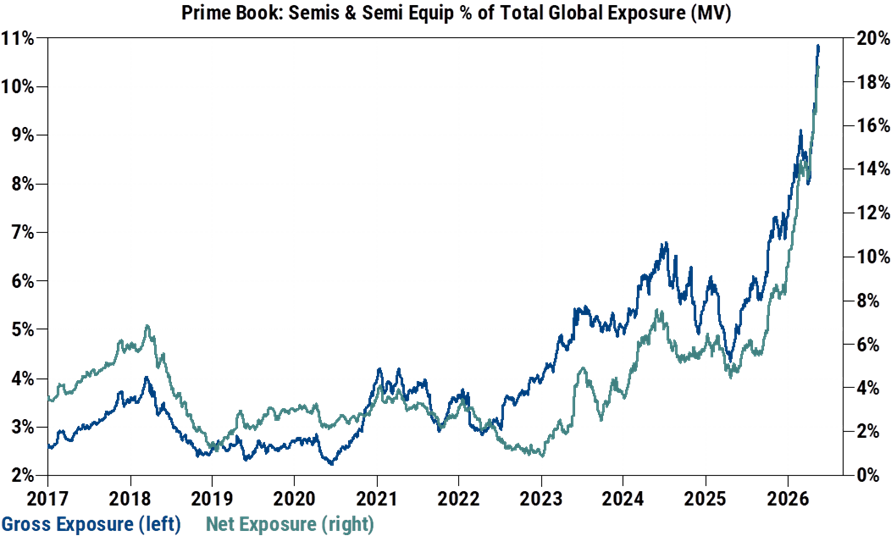
The increasingly popular idea of long energy and long semis (barbell trade) as a replacement for 60/40 is an abominable bit of extrapolation bias that is probably going to cost people a ton of money. It’s a pure momentum factor portfolio and momentum doesn’t always go up.
Here is this week’s 14-word stock market summary:
Positions that benefit from a quiet summer are nice. Covered calls and so on.
A crazy anecdote:
In the mid-1960s, there was a company called National Video. It made color television picture tubes, and its big moment came when it became the producer of the Motorola-developed 23-inch rectangular color TV tube. Color TV was the exciting tech boom of the day, and National Video had the hot bottleneck product. Demand ripped. Capacity was tight. The stock went vertical.
Then, Motorola, Zenith, Admiral, Philco, and others pushed into their own tube production or alternative supply. The thing everyone desperately needed from National Video became a thing they could increasingly make or source themselves. The company eventually filed for Chapter X reorganization in 1969.
National Video’s ticker was NVD-A.
I learned this from Walter Deemer.
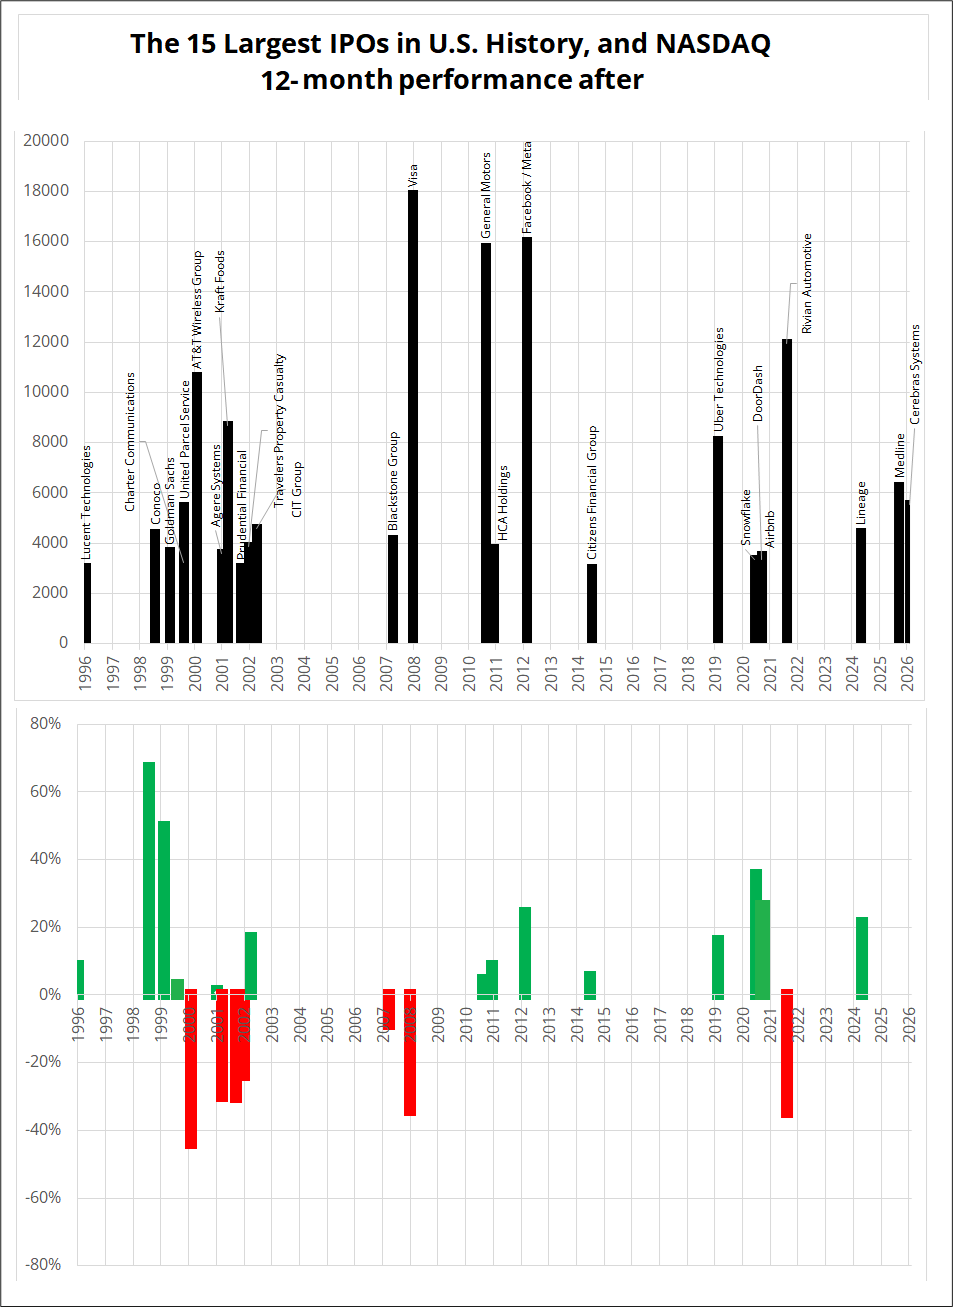
With an unprecedented flurry of ginormous IPOs imminent, many clients have asked me whether I believe the massive wave of equity supply will be bearish. The simple answer is that, yes, it is almost surely a bearish factor, but it is not tradable in isolation.
This chart shows the 15 largest IPOs by U.S.-headquartered companies and below that is how NASDAQ did in the next 12 months. You can see the flurry of IPOs preceding the dotcom bubble burst and the 2008 GFC, along with other less nefariously-timed IPOs. Note that the largest IPO on there is Visa at $18 billion and the SpaceX IPO could be around $75B(!). Largo. And OpenAI could be another $60B. Can the market absorb that much selling? Again, I would definitely mark down the coming IPO wave as a potentially bearish factor, but not a reason to exit longs or get short.
I am particularly interested to see how TSLA and VCX and a few other specific stocks play out. Tesla is a container / memestock for anyone who wants to invest in Elon Inc. SpaceX will likely dilute the Elon-lover vote and send some dollars out of TSLA into SPCX.
Tesla’s years-long persistent overvaluation vs. peers conundrum means the question is relevant because any mild reversion towards car company valuations would be disastrous for the stock.
But then again, the robots are coming right?
VCX is a bit like GBTC in that it’s a closed-end fund trading light years above NAV because retail traders can’t get access to SPCX, OpenAI, and other hot up and comers. Presumably money will flow out of that thing into SPCX as well. By the time SPCX and OpenAI go public, one might logically assume that VCX will converge from $250 currently to its $19 NAV. Not investment advice. Convergence to fair value is not guaranteed and can take longer than you or I can remain solvent.

https://www.spectramarkets.com/subscribe/
The mind-blowing explosion in Japanese yields took a breather this week and global markets cooled, coming off the boil just a bit.
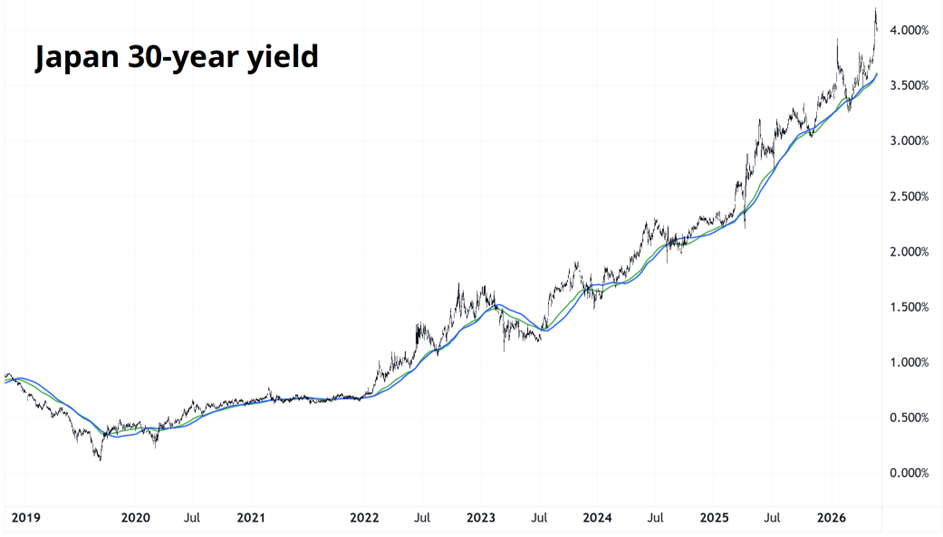
A 30-year bond yield going from 0% to 4% in six years is not something you will see again in your lifetime so enjoy that chart and breathe in its glorious smell. I cannot believe that the government of Japan still has not ordered GPIF and Kampo to start rotating out of global assets and back into JGBs. It’s such a no-brainer as it stabilizes bonds, supports the yen, and takes profit on a massive domestic underweight that has been a huge success post-Abenomics.
Elsewhere, the U.K. bond market has also stabilized as the June 18 by-election that could unseat Starmer is a bit too far away to trade and Burnham, the challenger to the U.K. PM is making soothing noises on fiscal. The trend in the bond market has been down for years and there’s nothing on the near-term horizon that looks like it will provide any chance of a reversal.
I took profit on short EURUSD this week simply because we are in a low-vol environment and sentiment and positioning have gone from lazy short USD to moderately long and rates positioning has also flipped to the point where many have grudgingly accepted the idea that the Fed might hike in 2026. This was a crazy idea just a few months ago and now it’s accepted and priced in.
EURUSD keeps trying to take out 1.1570/00 but cannot, for reasons unknown. There have been three strong waves of selling of EUR but it has held in each time. Possibly interesting. The divergence in economic surprises between Europe and the U.S. that I highlighted two weeks ago is now well known and well priced. We need a new theme or new catalyst to get a higher USD from here. The bullish USD narrative is known and priced.
Overall, FX interest is not particularly strong right now as the market has pulled back on max BRL longs, and is getting bored of the CNH and HUF trades, even though they are both working. Repeated attempts to short the Great British pound continue to bear little fruit.
EURUSD has done a pretty good job of following rate differentials lower and oil higher for the past two months and has shrugged off the latest move lower in Germany vs. USA rate diffs because of the lower oil price.
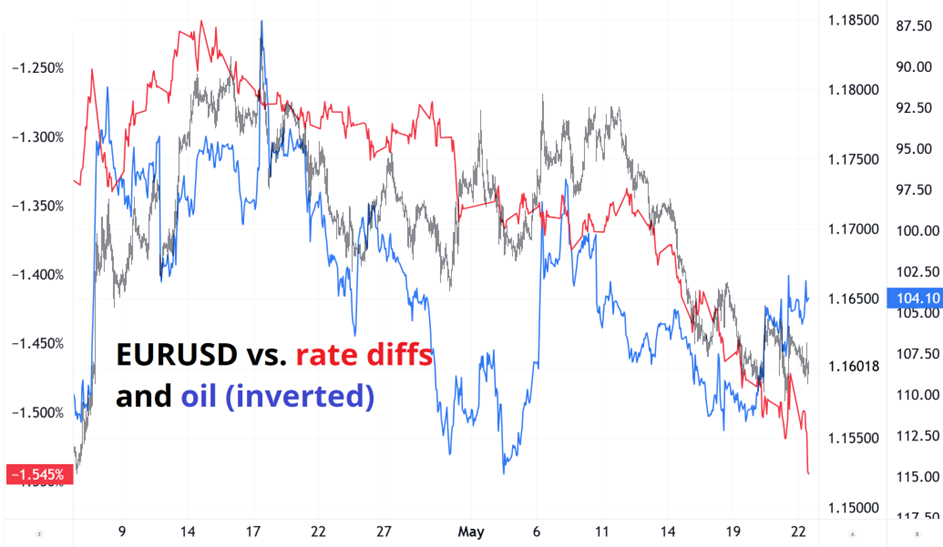
Red line is Germany vs. USA 10-year yield differential. Blue line is Brent Crude, inverted
I’m flat in FX right now. If I was forced to have a view, I would be long carry. HUF, BRL, or INR or all three. INR only wins if the war stops.
Simon Flint was discussing what currencies might benefit most from an end to the war in Iran and came up with a double filter of 1) Change since the war started and 2) correlation to oil. I thought that was interesting so I made this chart. ILS and NOK stand out as big winners since the war, while Asian currencies, CLP, and ZAR have been hurt the most.
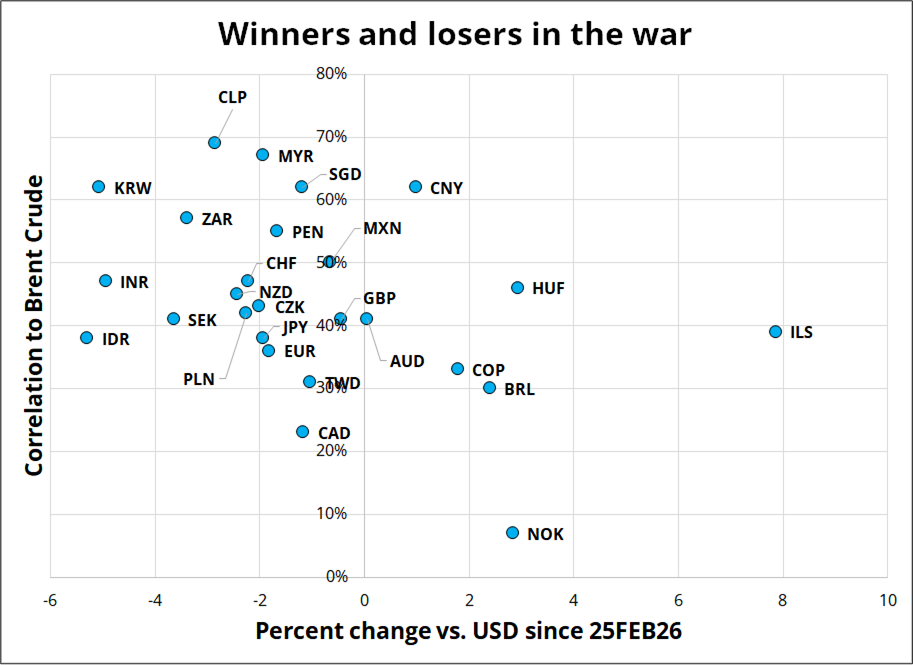
ZAR is probably hurting partly because of the big drop in gold, while the Asian currencies cannot buy a bucket as higher oil and mega outflows hurt there.
KRW has been one of those currencies where nobody can find a framework that works. Similar to the way it always makes sense to be short CHF but it never works, it always makes sense to be long KRW—and it never works.
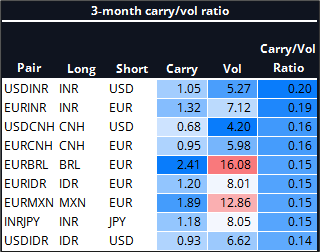
INR and IDR also show up as best in show on the carry/vol screener, so if you believe the war is going to be over or the market is going to stop caring about it over the next few months, maybe it’s time to put some trades on there.
Note USDCNH is in there given the low vol but CNH is not a real currency, it’s a policy tool. So you cannot expect to make money long USDCNH as a carry trade. The 1-year USDCNH forward is 6.62 so unless you think the slope of the appreciation slows, you will lose money long USDCNH. You can see in the chart below the slope priced in now is more similar to the 2025 rate of appreciation, not 2026.
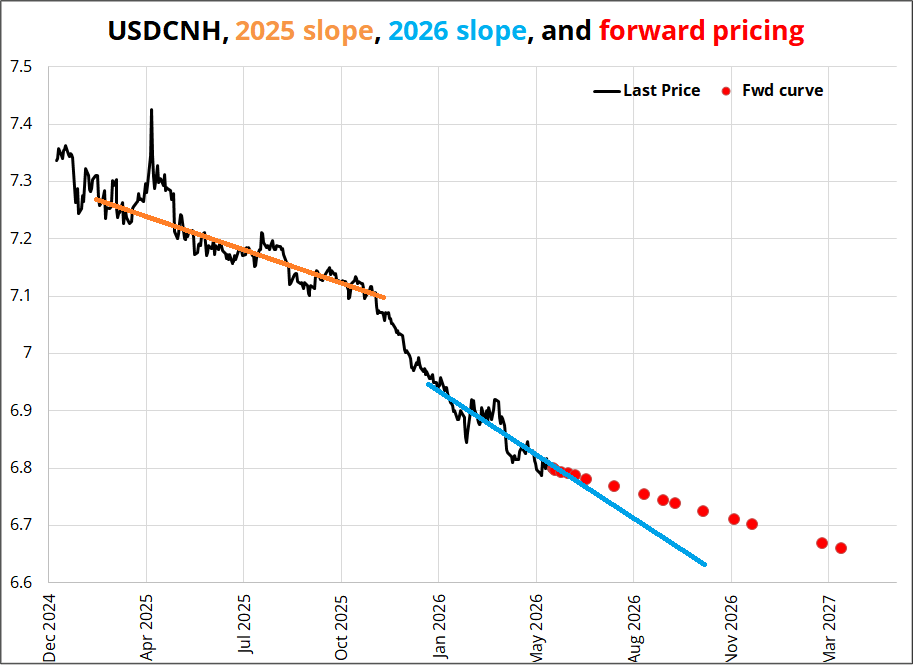
So there is money to be made betting on a continued appreciation pace, and that’s why Simon Flint likes one-year 6.50s. Keep an eye on the fixings and Simon Flint’s commentary if you trade USDCNH. Simon’s all over this stuff and I am a tourist sailing through. Note the recent continued appreciation in CNH comes despite a stronger USD vs. G10.
HYPE and PURR leaving the rest of crypto in the dust as they are the current attention magnets. Of possible concern in the short term is the double top at 62 in HYPE and $8.70/$9.00 in PURR.
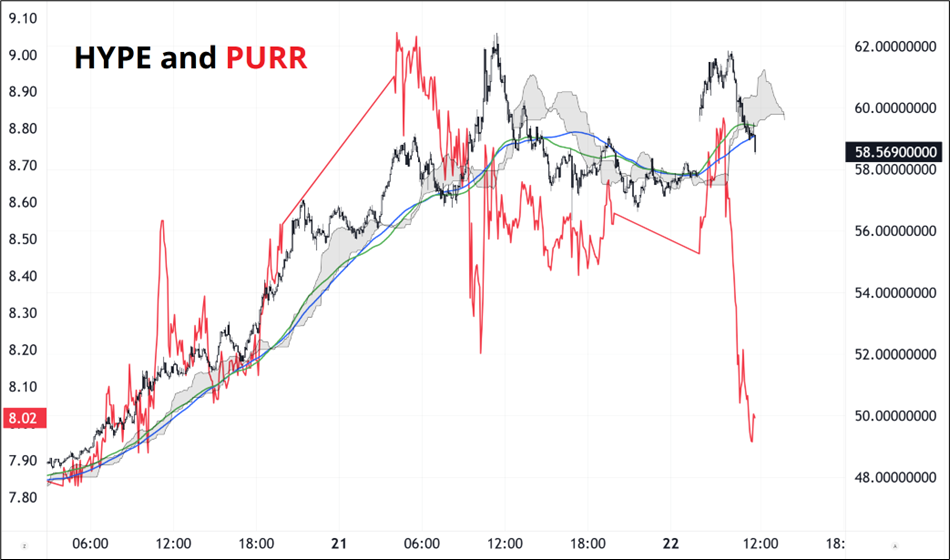
For longer-term holders, the question is whether this bull market can be sustained, or it’s just another hype cycle like DASH, NEO, DOT, DOGE, MANA, LUNA, FTT, AXS (Axie Infinity) and SOL, etc. etc. etc. There are so many stories about how the blockchain is going to revolutionize various industries and yet those coins were not great to buy and hold. To say the least. Most of them did not, in fact, revolutionize payments or video games or TradFi. They just went up on hope and fell back down. It’s incredibly difficult for such a crowded asset class to maintain momentum in one coin for a long period. But it’s possible, of course. If anyone can do it, HYPE can!
The market loves energy and commodities in general as a derivative way to play both the capex explosion and the War in Iran. Both sectors are crowded, but whether or not that matters will depend on what happens in real life, not just in markets.
Of all the commodities, I like gold the best because there have been huge unwinds with retail and central banks selling and I think the market is clean now (finally) after gorging on calls for months before the war. This chart from Alf is nice:
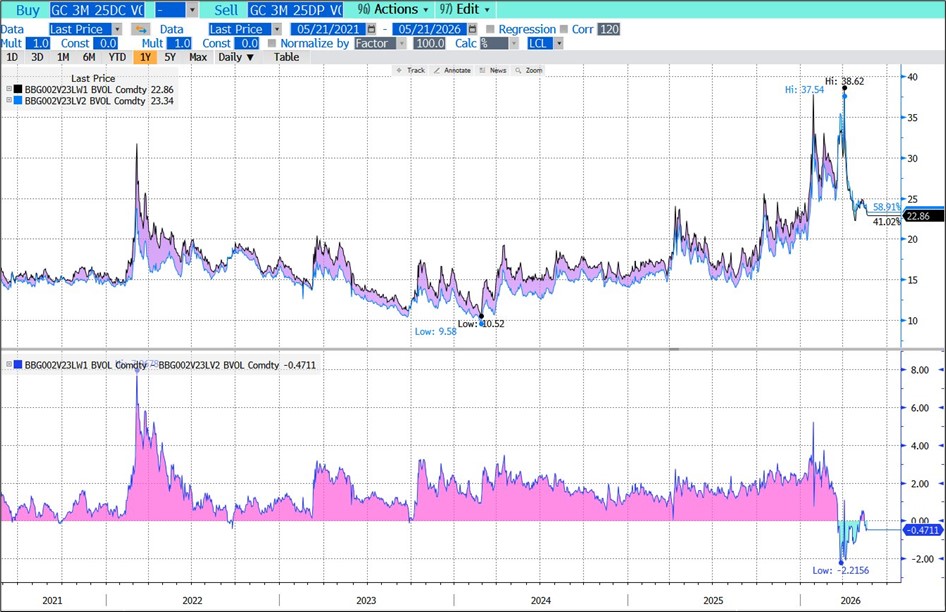
The bottom panel shows 25d call vs. 25d put. Calls have been bid over puts for years. If central banks are finally done selling, it could be a good H2 for gold as we retest the all-time highs by the end of 2026. The biggest risk to everything, including gold, is that inflation gets out of control and we get a repeat of 2022. That feels like a 15% chance type of scenario to me. Nowhere near the base case, but easily possible given the second-round risks from the oil rally and capex mania.
It’s all one trade, war on war off.
That’s it for this week.
Get rich or have fun trying.
“The machine which can learn and can make decisions on the basis of its learning, will in no way be obliged to make such decisions as we should have made, or as will be acceptable to us. For the man who is not aware of this, to throw the problem of his responsibility on the machine is to cast his responsibility to the winds, and to find it coming back seated on the whirlwind.
The hour is very late, and the choice of good and evil knocks at our door.”
Norbert Weiner, 1950.
*************
*************
Thanks for reading the Friday Speedrun! Sign up for free to receive our global macro wrap-up every week.
