Looking at why trading the Month End Model in FX has become less profitable and why I think that is a permanent regime shift, not a temporary one.
rabbit holes
RIP Month End Models

Current Views
1-month 0.99 EURUSD digital put at 18%
Spot ref. 1.0210
Expires August 18
Rabbit Hole #5
RIP: Month End Models
Welcome to Rabbit Hole #5. The Rabbit Hole series offers deep dives into random trading and macro topics that fascinate me. Today I look at why trading the Month End Model in FX has become less profitable and why I think that is a permanent regime shift, not a temporary one.
The Month End Model
When you make money on a specific trading strategy, methodology, or inefficiency for many years, and then there is a regime shift and the strategy stops making money, it can be like trying to let go of an old friend who has become a bad influence. It’s tough to let go. But it’s now time for me to say goodbye to trading the Month End Model in FX.
Over the years, one of the most stunning, persistent violations of the efficient markets hypothesis in currency markets has been the month-end effect. On the last day of every month, equity hedgers execute large, predictable flows into 4 p.m. London (11 a.m. NY) and there has been an opportunity to systematically profit by forecasting and trading those moves for at least the past 17 years.
I have traded the “Month End Model” as part of my discretionary process since 2005, and I also traded it systematically for many years. The Month End Model has delivered a hit rate of 60%-70% (depending on the currency) with returns significantly in excess of transaction costs… For almost two decades.
But now, I believe the effect has passed its expiry date. In this piece I’ll explain why.
I first learned about the Month End Model in 2005 and started trading it religiously in 2006. It probably existed before that. The basic premise has been:
- Hedged equity investors rebalance their FX hedges at month end.
- Foreign ownership of US equities is the dominant flow because US equity markets are extremely large and heavily owned by international investors.
- Most of the flow is centered around 4pm LDN, driving outsized moves as the flow was too big for the 5-minute window.
The basic model that we used in 2006 became more complicated over the years but the added complexity didn’t much change the results of systematically trading month end. The basic model is:
- If S&P 500 is up more than 2.5% on the month, sell USD at 7am NY and exit at 11am (WMR fix).
- If S&P 500 is down more than 2.5% on the month, buy USD at 7am NY and exit at 11am (WMR fix).
Most profitable currencies: GBP, AUD, EUR, and CAD. Important note: USDJPY is backwards (so if the model says sell USD, you buy USDJPY). Few understand this.
You can play around with the parameters, but those are close to optimal. For example, you can loosen or tighten the S&P trigger (the more selective the trigger, the higher the hit rate, but then there are fewer trades) … or change the entry and exit times (exit slightly early, say 10:59:00 to beat the crowd, or enter at 3pm the day before, or enter at 10:30am on the day of and only hold for 30 minutes, etc.) Changing parameters yields different Sharpes and returns. A higher Sharpe is always accompanied by lower overall returns because the less directional risk you take (by shortening the holding period) the smaller the returns, but the higher the hit rate.
Every major bank produces a forecast for the Month End Model signal and many of those forecasts incorporate other market moves like global fixed income, non-US equities and exchange rates. Believe me when I say that the different models do not generate meaningfully different outputs. It is nearly impossible for one bank to forecast USD selling while another forecasts USD buying because the models are all similarly constructed and mostly driven by US equity performance.
Why the Month End Model is a thing
The easiest way for me to explain why equity investors are doing these month end trades is to give a simple example. My example applies roughly to most countries, except Japan, where the dominant equity hedging comes from GPIF and other entities that don’t use month end.
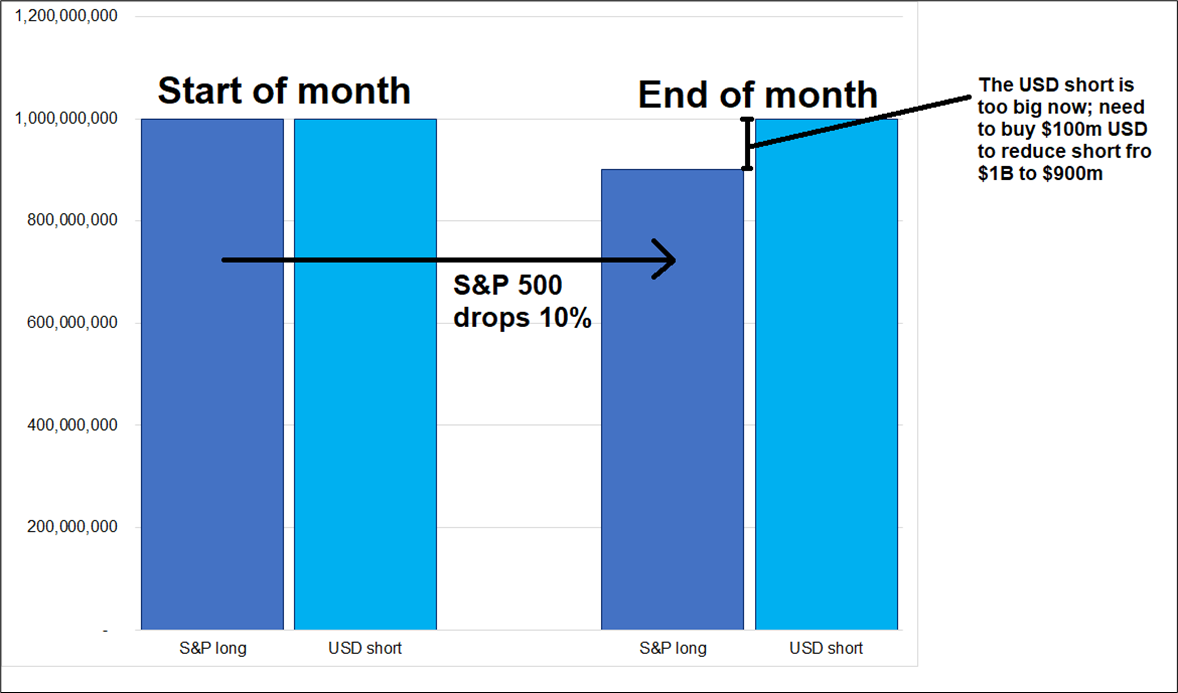
Let’s say you are a UK pension fund manager, and you are long $1 billion of US stocks (S&P500). To keep it simple, we will say they must be 100% currency-hedged by rule, but in reality, the percentage varies from 100% down to 0%, depending on the institution and domestic pension regulations.
So you are long 1 billion USD of S&P500 and short 1 billion USD against your home currency as a hedge.
Now, if the S&P 500 drops 10% this month… Now you have long 900 million USD notional of S&Ps but you’re still short 1 billion USD on the hedge (ignoring moves in the exchange rate for now). To get your hedge right-sized, you now need buy 100 million USD to get your short USD position down from 1 billion to 900 million so that it matches the equity exposure. Your portfolio is benchmarked to 11am NY (4pm LDN) on the last day of the month. Here is a diagram of what I just wrote:
There is much more complexity to this because exchange rate moves, and all sorts of other stuff influence the real-life moves made by fund managers. But the aggregate is that if you just use the basic Month End Model, the errors from the other factors cancel out over time.
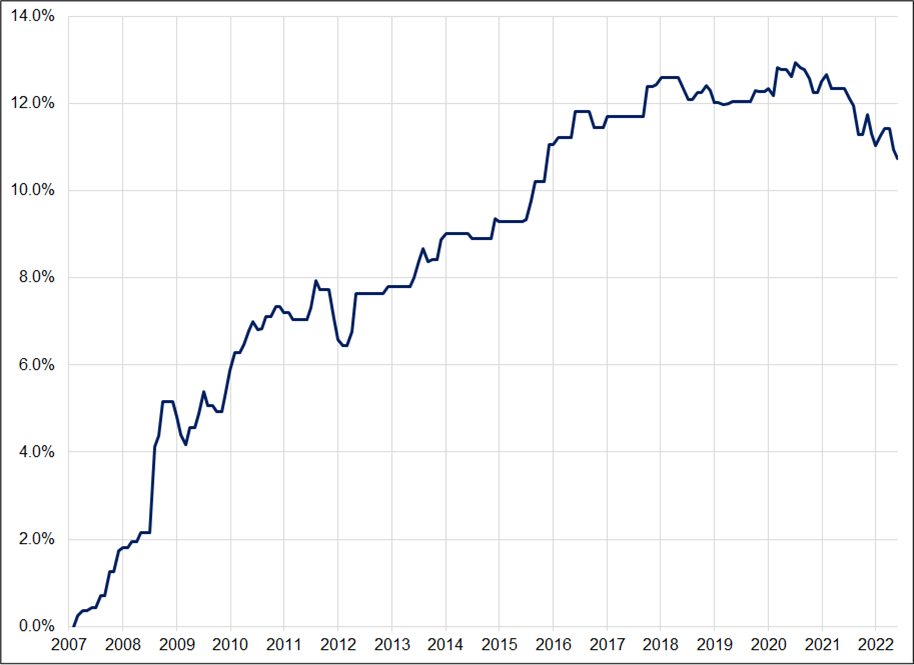
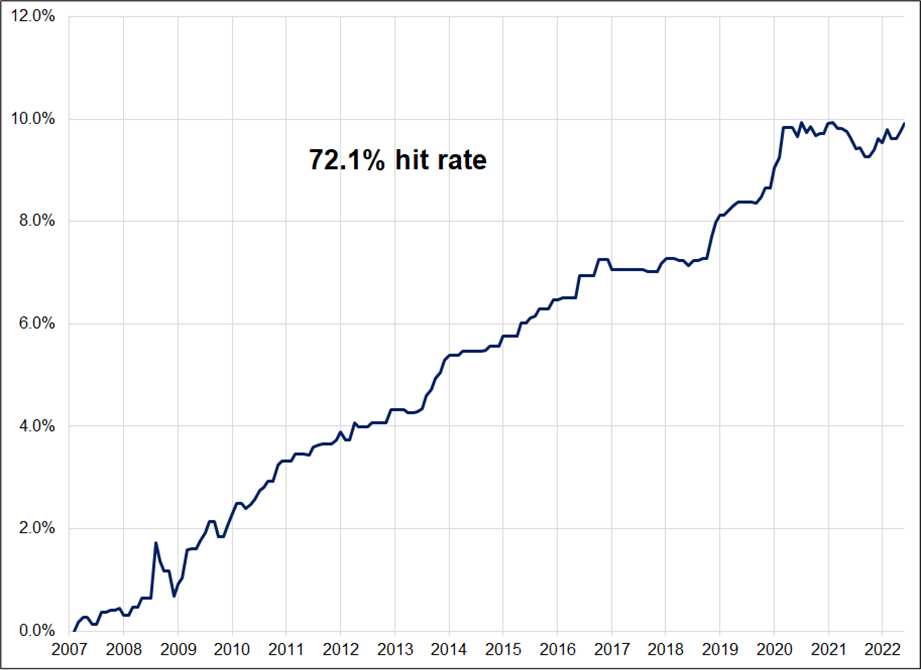
Here is the P&L of the Month End Model in EURUSD. It is the cumulative P&L of going long or short EURUSD from 7am to 11am on the last day of the month using the signal from the Month End Model. If SPX moved less than 2.5% up or down, the model stays flat.
P&L of standard EURUSD Month End Model, 2007 to now
Thanks be to Justin Ross for help on this. He gets the assist on today’s piece.
The hit rate of that model is 62% overall but is sub-45% since 2018. Now the question of efficient markets has often been raised over the years as many wonder how the same, well-known model could work out of sample for 17 years. There are two main answers:
- The flows are huge. Even if specs are doing 1 billion in aggregate to try to profit from the model, the real flows are sometimes > 10 billion. I have done a single trade of over 3 billion for one client on a single month-end WMR rebalance. The flows are h u g e.
- It doesn’t work every time. People who don’t really know the model but see it working sometimes trade it for a while, then when it doesn’t work, they say, “this is stupid” and they move on. Then, it works really well again for a bit and everyone gets excited about it again. Classic “humans doing that performance chasing” thing.
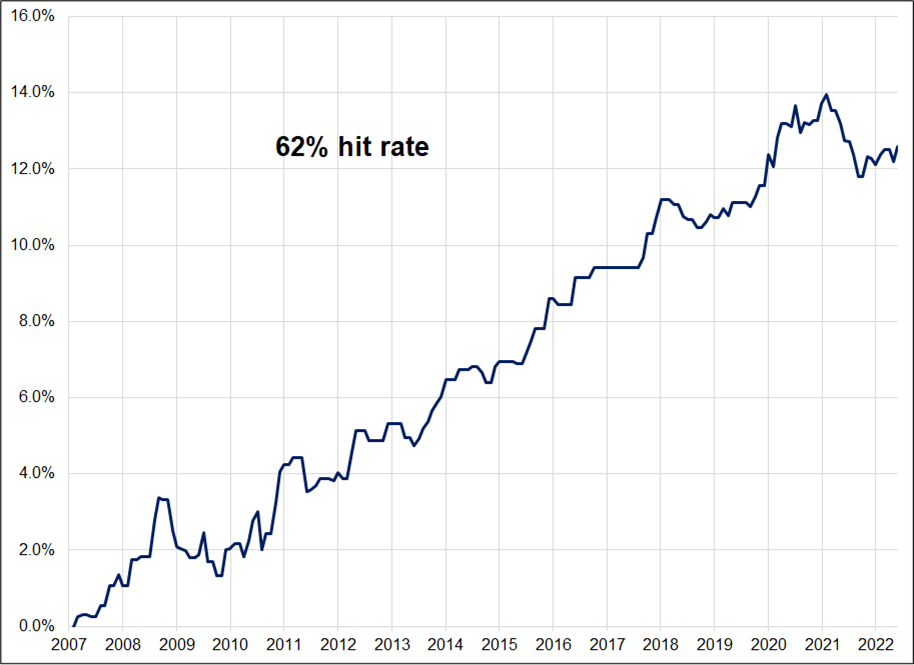
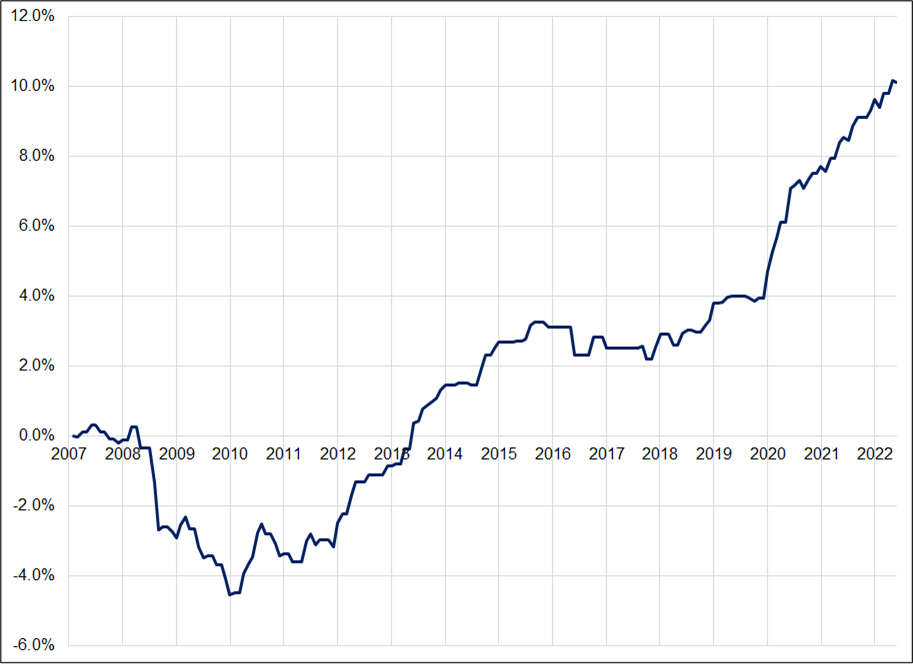
Before I get into why I don’t think the model will work anymore, here is the P&L of the Month End Model against some other currencies.
P&L of standard Month End Model, GBPUSD (top) and USDCAD (bottom), 2007 to now
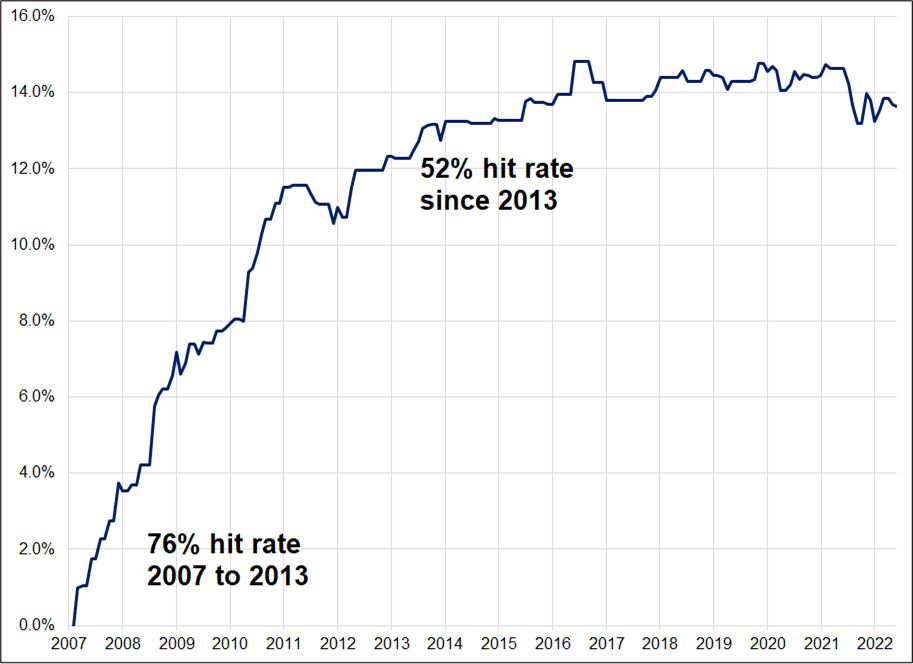
The USDCAD chart is important here because you can see that that model stopped working around 2013. This gets to the heart of the matter. The model only works if real world hedgers are behaving the way the model predicts they will. It is not a coincidence that the Canada Pension Plan (CPP) stopped hedging its foreign investments around that time. In their 2013 Annual Report, they discussed it. Here is their explanation:
Changes in foreign exchange rates on our non-Canadian dollar investments have a substantial impact on short-term investment performance expressed in Canadian dollars. We do not manage this risk with currency hedging for four reasons:
- Hedging foreign equity returns tends to increase, rather than reduce, overall return volatility for a Canadian global investor. The Canadian dollar tends to strengthen when global equity markets are rising and weaken when they are falling. This is partly due to the Canadian dollar’s status as a commodity currency. We believe the Canadian dollar will continue to behave in this way.
- When the Canadian dollar strengthens against other currencies as a result of higher commodity prices, especially oil, the Canadian economy is also likely to be stronger. This in turn should lead to increased aggregate earnings for CPP contributors. As earnings rise, so will contributions into the Fund. Accordingly, this represents a natural hedge for us and reduces the need for explicit currency hedging of the Fund’s foreign investments.
- The cost of hedging currencies is especially high in emerging markets. However, if these countries continue to experience higher productivity and economic growth as their economies mature, their currencies should tend to strengthen over time. That would make a hedging program a long-term drag on returns.
- We can mitigate the volatility of individual exchange rates by holding a broadly diversified set of currency exposures across the world.
The CPP announcement did not come in isolation. Post-GFC, the general view among Canadian investors slowly migrated towards the view that hedging FX risk doesn’t make sense for Canadian pension funds (or Aussie ones, which are also correlated to equity and commodity markets). Regime shift!
More recently, post-COVID, there has been another wave of contemplation and more and more funds in more and more countries are realizing that even if you are going to hedge, jamming an entire month’s worth of hedges into the 5-minute WMR window at month end makes no sense. It is better to hedge dynamically or at much higher frequencies.
QIC
One study that grabbed a ton of attention was the report by The Queensland Investment Corporation, a government owned investment company owned by the Queensland government. The piece is called: “Trading at London 4PM and the Illusory Benefits of Maximum Liquidity”. It’s a well-written and convincing study of how the footprint of large trades at the 4PM WMR can be egregious, despite the high volumes transacting at that time. If everyone is the same way (and they often are!) the high volumes work to your disadvantage, not your benefit.
They highlight numerous examples from 2020, including this one at February 2020 month end (28FEB20):
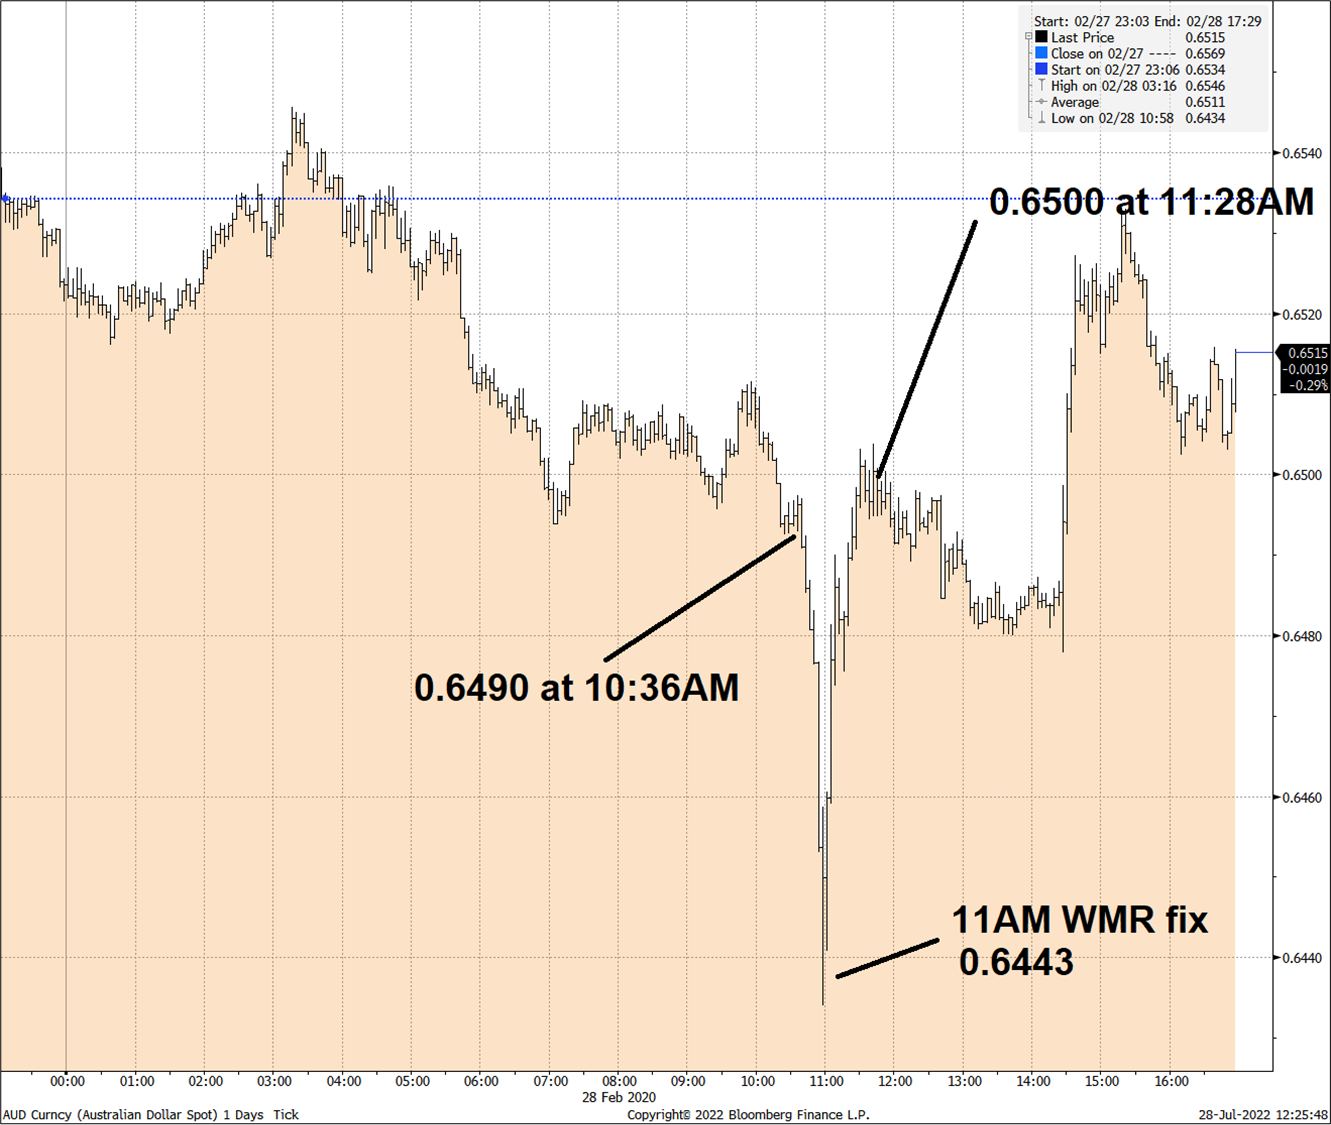
Here are two nice graphics from the QIC piece:
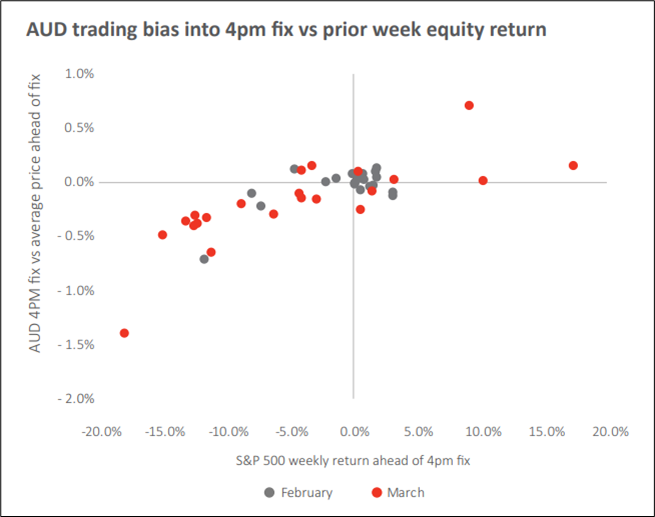
Their conclusion:
While London 4pm does indeed experience a surge in market trading volumes, this only becomes a liquidity benefit for investors if that trading volume is balanced. For Australian investors in particular, they will often find herd behaviour systematically skews the market as their trading needs often coincide with other investors, leading to significant invisible market impact costs when dealing at the fix. This calls for a more considered approach to achieve best execution and one which takes into account the market environment rather than methodically and naively trading at the fix.
A few more observations before I wrap up
Still, not everyone adheres to this new philosophy. There is significant tracking error if you don’t use the benchmark, and that can be important to some institutions and investors. There will still be activity at the month-end WMR, but its impact will be smaller and smaller over time. As such, the only strategy that will work will be one where you enter the trade much later (30 minutes before the fix, for example).
Large flows targeting the benchmark will still move the market in the last thirty minutes before the fix and that has always been the highest Sharpe way of trading the Month End Model. The hit rates are astonishingly high on the Month End Model that only holds for 30 minutes because it zooms right into the affected period and times the flow very specifically. The problem is, the returns are much lower because the holding period is so short you are getting certainty but not as much movement.
Also, because of transaction costs, the 30-minute strategy doesn’t work as well and has lower capacity. Here is the P&L of the GBPUSD month end model only trading for the 30 minutes into WMR:
P&L of modified Month End Model in GBPUSD, 2007 to now
Holding period is 30 minutes vs. standard model which holds for 4 hours
All the charts in this piece ignore transaction costs, which is an important omission. But I can tell you from experience that the model still massively outperformed transaction costs over time. We ran it systematically with real money for five years and it made decent cash in all five. The capacity is not huge, though, and it’s sensitive to transaction costs so much easier to execute if you work at a bank or somewhere with access to the primary market.
Even if you are not trading systematically, it’s good to know about month end so you don’t get your face ripped off or so you’re not the noob saying: “Whoa, what just happened to cable!?!?!?” at 11:02:30 on the last day of the month.
And finally, just for maximum clarity because I mentioned it earlier. The USDJPY signal reported by banks is almost always backwards. If you do the opposite of the standard model, the P&L looks like this:
P&L of inverted Month End Model in USDJPY, 2007 to now
IMPORTANT: USDJPY signal is reverse of all other signals, most banks don’t do this when making their predictions
My guess is that the USDJPY model will continue to work as there is no meaningful change in Japan vs. USA pension hedging that I am aware of.
My Conclusion
From talking to UK pension funds and those in the EU, and observing the rising failure rate of the Month End Model over time and particularly since COVID, my view is that hedgers are slowly, slowly moving away from the month end benchmark style and instead they are:
- Spreading out the flow over a few days or at least a few fixings. That is, instead of doing it all on the last business day, they will split their estimated hedging into three clips and do 33% X 3 days.
- Hedging dynamically, updating hedges weekly or each time SPX moves X%.
- Using very long VWAPs lasting 24 to 48 hours.
Therefore, I expect that trading the Month End Model will generally be unprofitable going forward, with the exception of the 30-minute bang bang version and perhaps the standard USDJPY version.
Don’t @ me if the model works perfectly tomorrow. That’s not the point. :]
Final Thoughts
Since 50% of people think yesterday’s FOMC was hawkish and 50% think it was dovish. I guess it was… As expected?
If you found this piece useful, please feel free to forward this one to anyone you think might find it interesting.
Thanks!