Two trades and a heads up.
The dashboard of the 1985 Nissan 300ZX went hard

Two trades and a heads up.

The dashboard of the 1985 Nissan 300ZX went hard
Short AUDNZD @ 1.1100
Stop loss 1.1361
Cover 31DEC
Short EURSEK @ 11.6000
Stop loss 11.8650
Flip long 06DEC
12DEC 109 / 107.50 CADJPY put spread
risking 48bps off 109.70 spot
There are some strong seasonal patterns from now until year end. Two of the strongest are the tendency for AUDNZD to move lower, and EURSEK to move lower, with a rally in mid-December due to Swedish pension flows, then lower again. I will provide a brief explanation for the theory behind the seasonality after, but let’s look at the data first.
I want to mention in advance that while this is obviously a bit of a data mining exercise, these seasonal patterns are not new, and they have generally worked out of sample for a long time. Seasonal patterns being well known is always a risk, though, as they can get crowded or front run. But in the case of AUDNZD and EURSEK, they are both at the top of the range right now and they are both second-fiddle currencies suggesting we don’t need to worry about them being crowded at this early juncture.
Here are the seasonality charts:
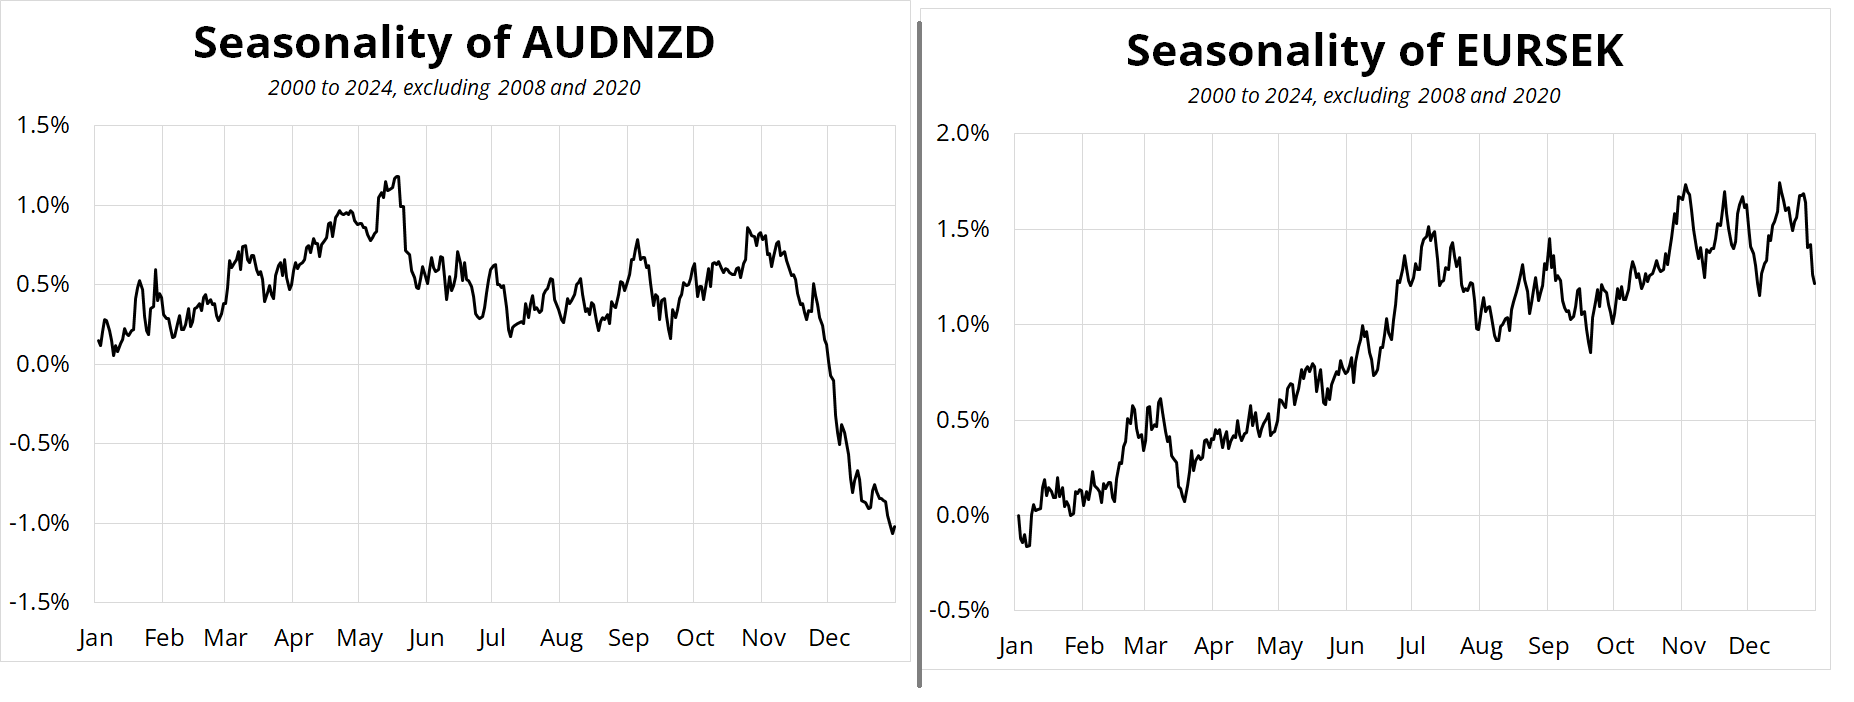
I know the one on the left looks a lot less random, but essentially EURSEK would look the same if it wasn’t for the Swedish pension flows which sell SEK from around the 5th to the 15th of December. Long story short in SEK is that the default for annual investment in Swedish pensions is for the money to go to global equities and the currency hedging leads to ~40bn SEK of outflows in a 10-day window, approximately. The amounts vary, but that’s the gist.
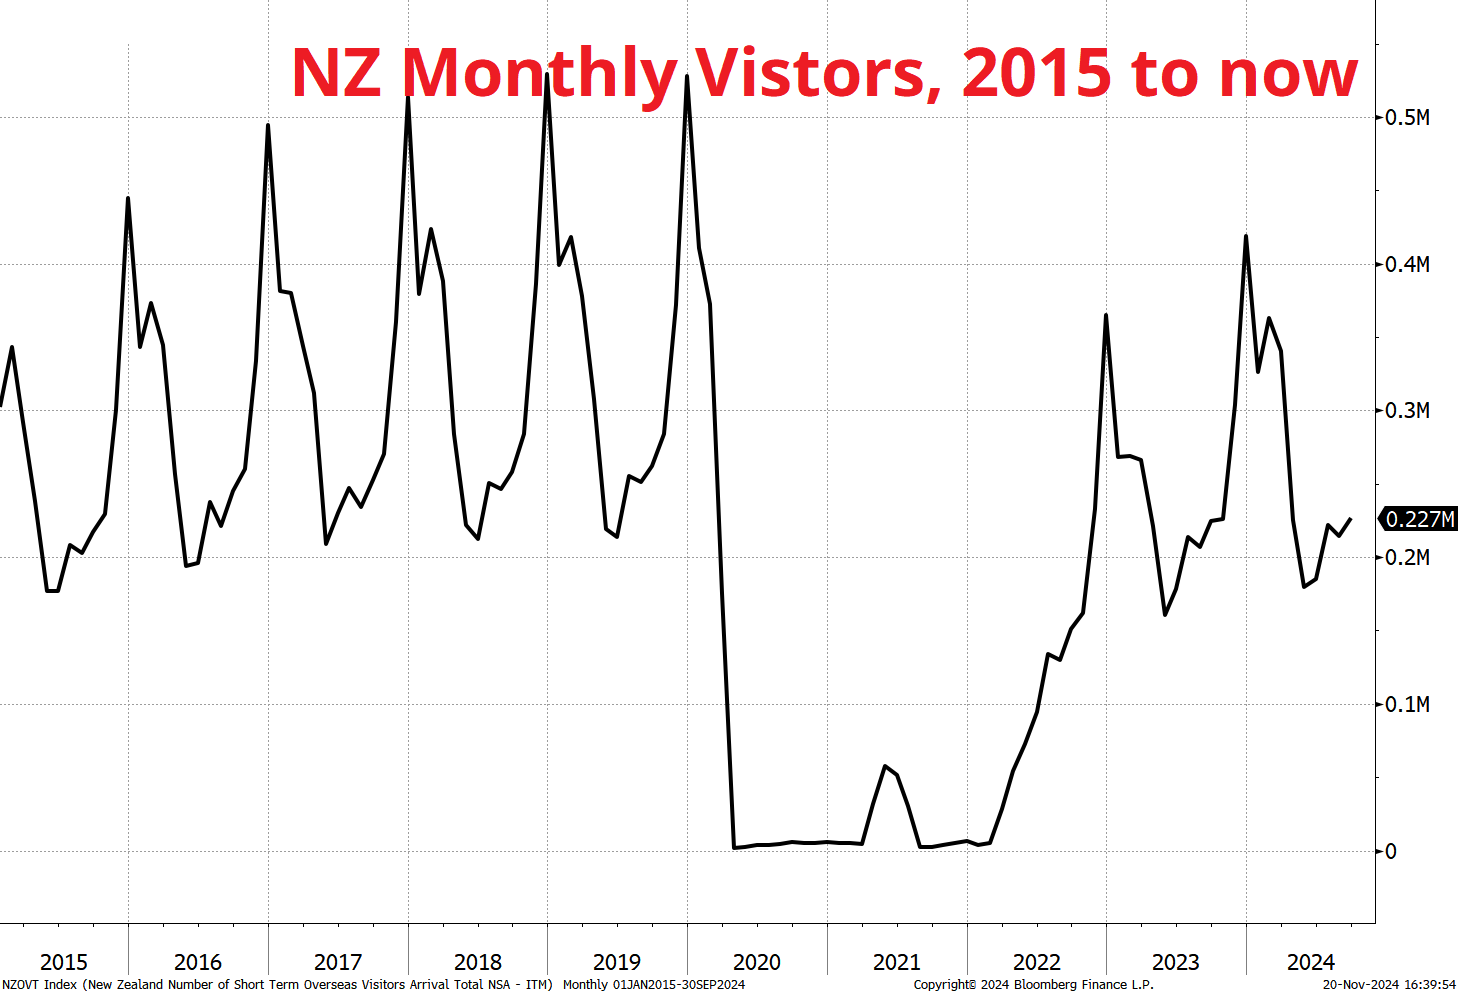
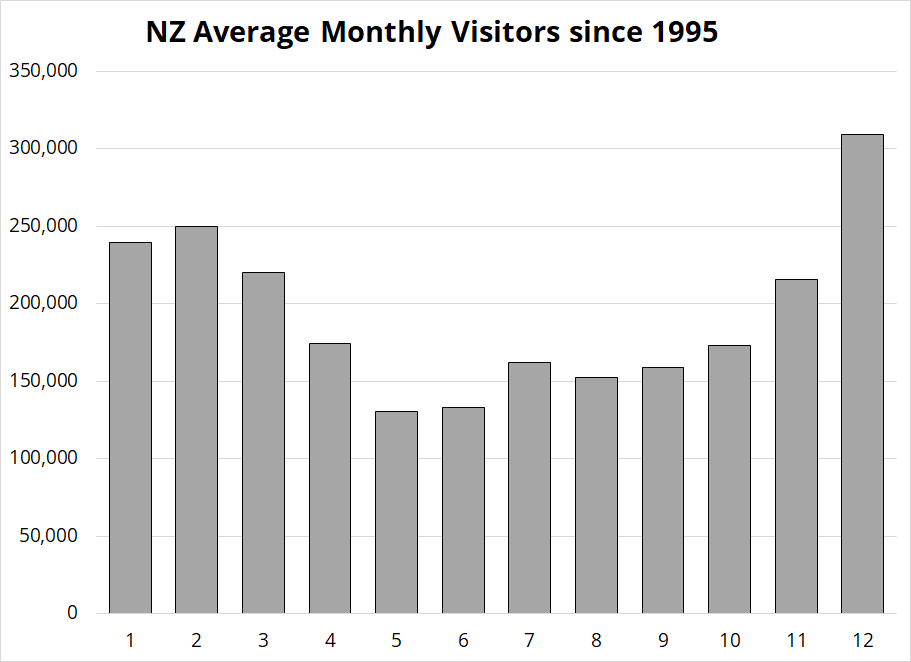
The standard explanation for the AUDNZD move lower is that tourism to New Zealand skyrockets in December. It also increases in Australia, but the relative magnitude is different as 500k overseas visitors come to NZ in December (9.7% of NZ population) while 1 million come to Australia (3.7% of Australian population). So, the relative impact of the inflow spike is larger in NZ.
Here are the trades:

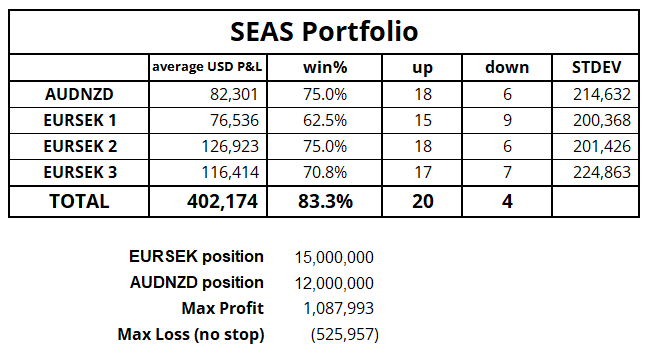
And here are the outcomes for the past 24 years. Note that I have put specific trade times above as I feel those are optimal for various reasons (liquidity mostly) but the backtest uses daily data. I can assure you it makes very little difference to the results. “SEAS” stands for Seasonal EURSEK AUDNZD Strategy.
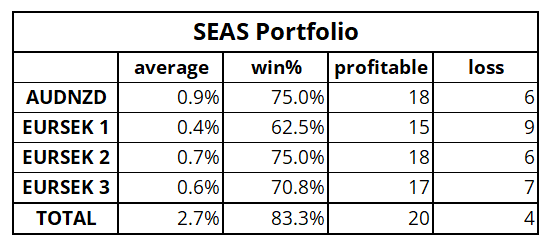
The hit rates are high, and the returns are good. There is a challenge with something like this around risk management. For example, if you just run the whole thing without stops, using a position size that is reasonable, weighting the trades roughly even by P&L risk, you get this:
The problem for me with this approach is that I never trade without stops. And while most the drawdowns are not huge on these trades, there’s a couple where the drawdowns were large. No stop loss is almost always optimal for systematic strategies, from an expected value point of view. But from a risk management point of view, stop losses provide insurance. Insurance is negative expected value, but it’s still useful!
So, my plan is to do this as four separate trades and use logical stop losses. In this case, looking at the chart and thinking through some basic logic, I think the stop loss on the AUDNZD short should be 1.1361 and the EURSEK should be 11.8650. These are wider stops than usual for me, but the holding period is long, especially on the AUDNZD which will run for 40 calendar days. 1.1361 is about 6 ATRs away.
The results above do not include transaction costs, but I don’t think they are a huge issue. In fact, you can beat the model pretty easily on December 31 by simply covering in the morning instead of waiting ‘til EOD. Both EURSEK and AUDNZD tend to make their low right around NY open on New Year’s Eve most years. So, a bit of fine tuning on execution can probably lead to low or zero or maybe negative transaction costs.
There is an important caveat here that I want to discuss, even though you might not like it. Here I show the P&L of the four-trade strategy, by year, using 15 mio EURSEK and 12 AUDNZD. At first glance, it looks like the strategy is decaying, which might mean that it’s overcrowded. But the negative results in 2020 and 2021 are mostly a result of two things.
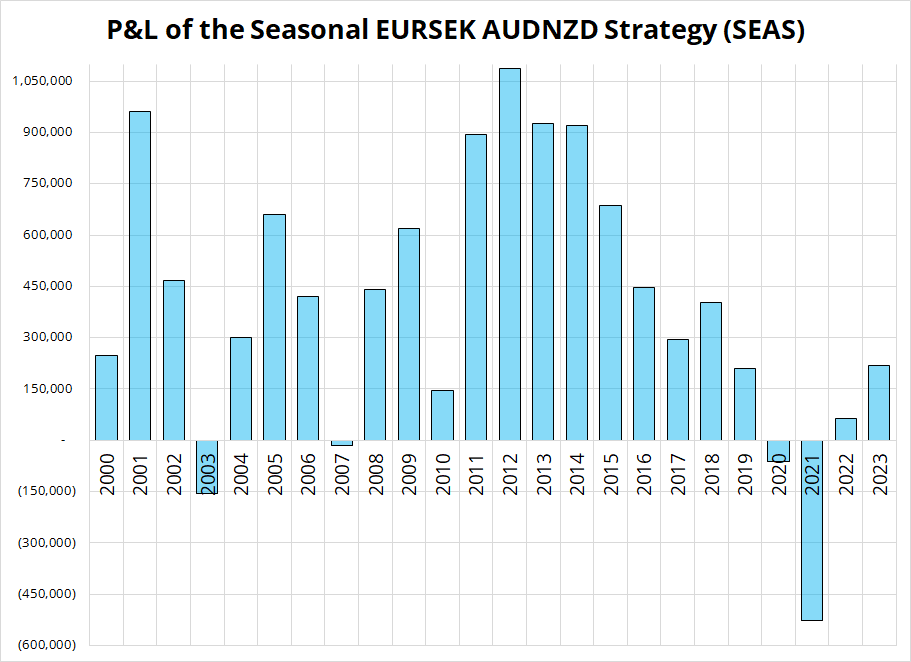
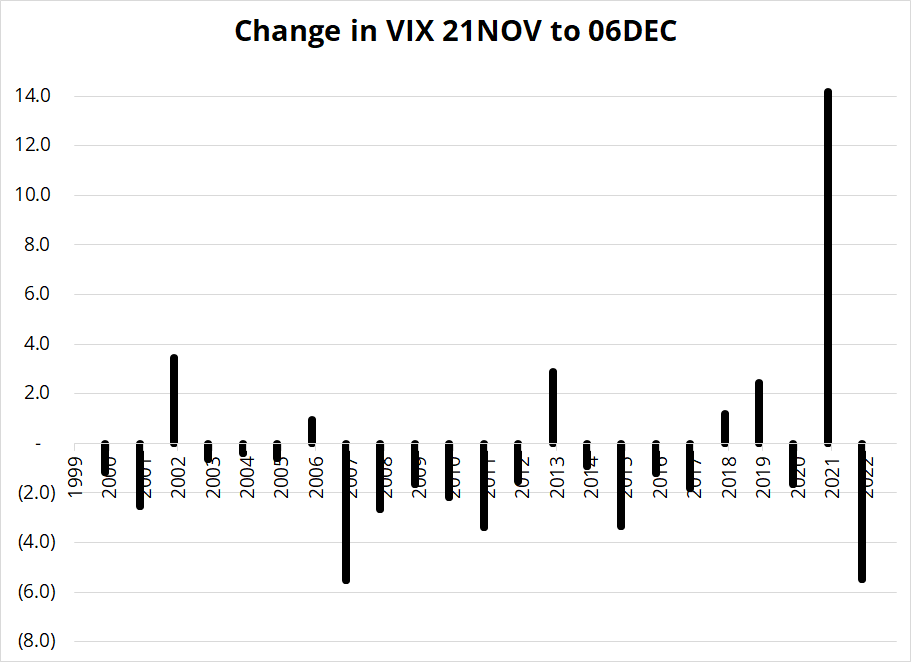
Yes, of course, VIX could skyrocket again in the next few weeks, but the odds say that’s not likely. So unique factors conspired in 2020 and 2021, and I think if anything those two bad years will dissuade speculators from getting overly involved in this trade.
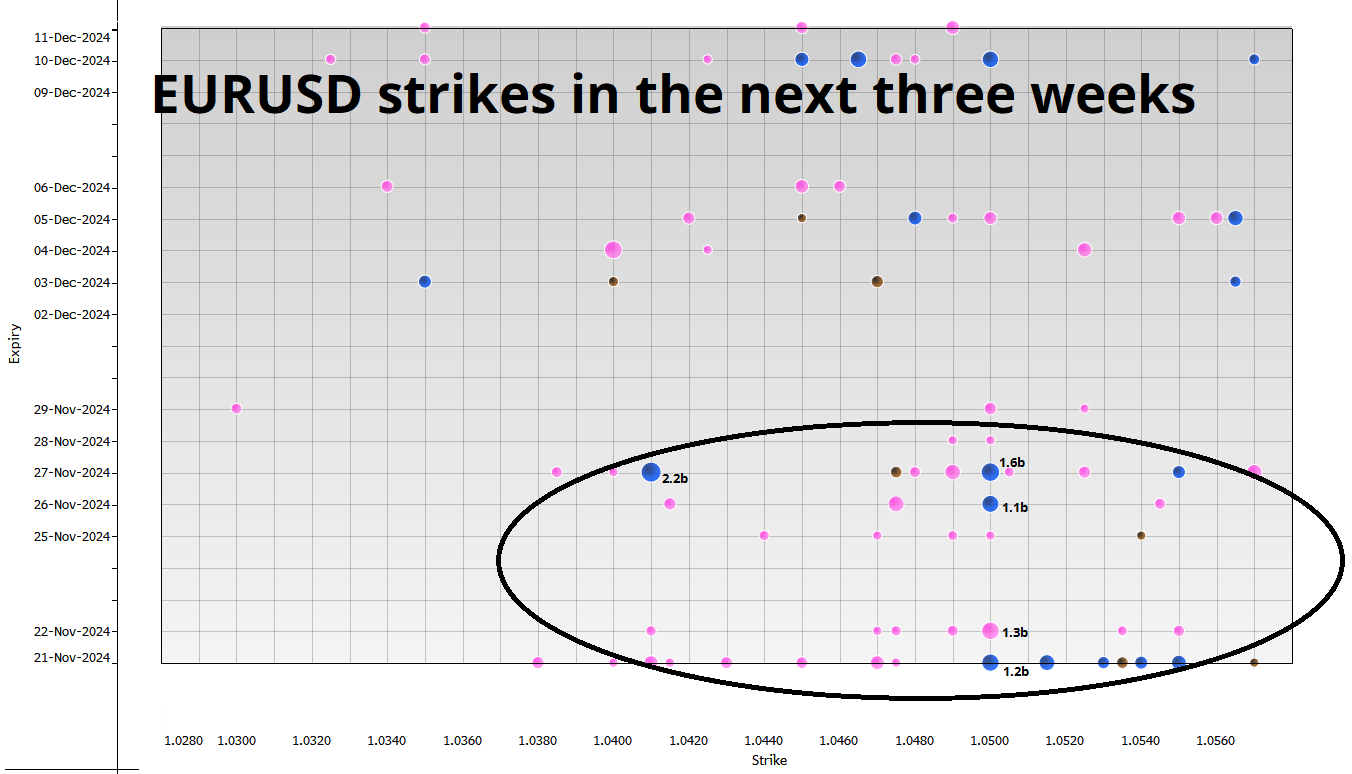
I have been writing about the idea that EUR would consolidate for a while now (since 13NOV)… I think that could end soon. One of the main sources of congestion in the market has been the enormous strikes and exotics all centered around 1.05. If you look at the upcoming expiry report, you can see that Thanksgiving Wednesday is the last big day, then it clears out significantly.
There could be a race to reload downside next week. Don’t be late!
MSTR 524 pre-market. MSTU 300.
Have a green day.
1985 Nissan 300ZX dashboard.
No less than four on-board microcomputers.