Seasonals are printing and Atlanta beats New York

A comic by Shanghai Tango

Seasonals are printing and Atlanta beats New York

A comic by Shanghai Tango
Short USDCHF vol expiring 30APR
Sell put spread: 0.7800/0.7780
Sell call spread: 0.7860/0.7880
Risk 1 to make 1.1
As we are about 30% of the way through 2026, it feels like a good time to check in on the seasonality trades so far. In the Spectra Trader Handbook and Almanac, we isolate the most bullish and bearish periods for a cartload of securities and come up with 189 separate bullish and bearish signals. 54 of these have triggered so far this year. To make life easier, I am going to start publishing the month ahead signals on the last day of the month.
If you want to read about why seasonality is real, please see here.
https://www.spectramarkets.com/amfx/seasonality-is-real/
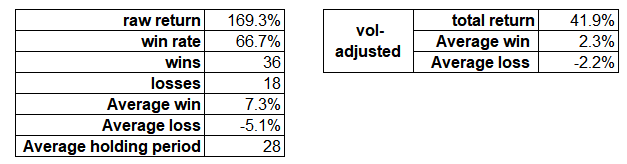
We have been publishing the signals since 2023, and the overall results have been excellent with 2023 and 2024 showing impressive P&L but 2025 was negative. Results so far in 2026 are as follows:
I think about seasonality as just one of many inputs into a trade selection process. If you keep looking for things that give you a small edge, and stack them on top of each other, you will come up with trade ideas that have alpha. This is similar to the idea that if you have 10 uncorrelated strategies with a Sharpe ratio of 0.5 and you risk-weight them equally, they will stack to create a portfolio with a Sharpe of 1.6.
Similar to technical analysis, I don’t use seasonality in isolation, though many funds do run successful seasonality strategies. Instead, I try to find small edges through technicals, flow, seasonality, macro, behavioral, pattern recognition, and so on and then look for trades where multiple planets align.
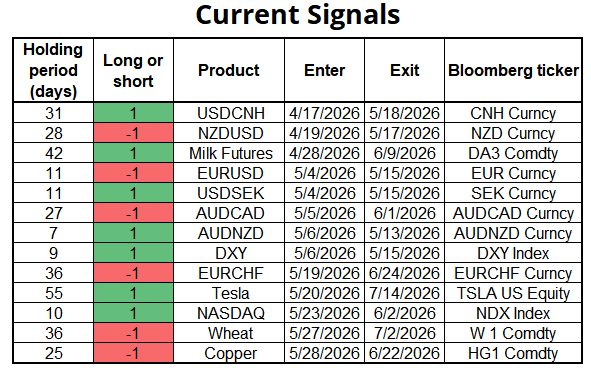
For some reason, we only publish the seasonality signals in the Almanac, but starting now I will publish them in advance in here. My plan going forward is to publish the signals in batches in advance because I find I miss a lot of them if I don’t have the Almanac on my desk. The table below shows all signals from 17APR to 31MAY.
In case you’re curious, here are all the trades so far this year. It caught the bulk of the gold and silver rallies and the crude oil rallies plus juicy shorts in AMZN and GOOG and profitable longs in AMZN and international equities. The two biggest whiffs were both in ETH as signals were long and short at the worst possible times.
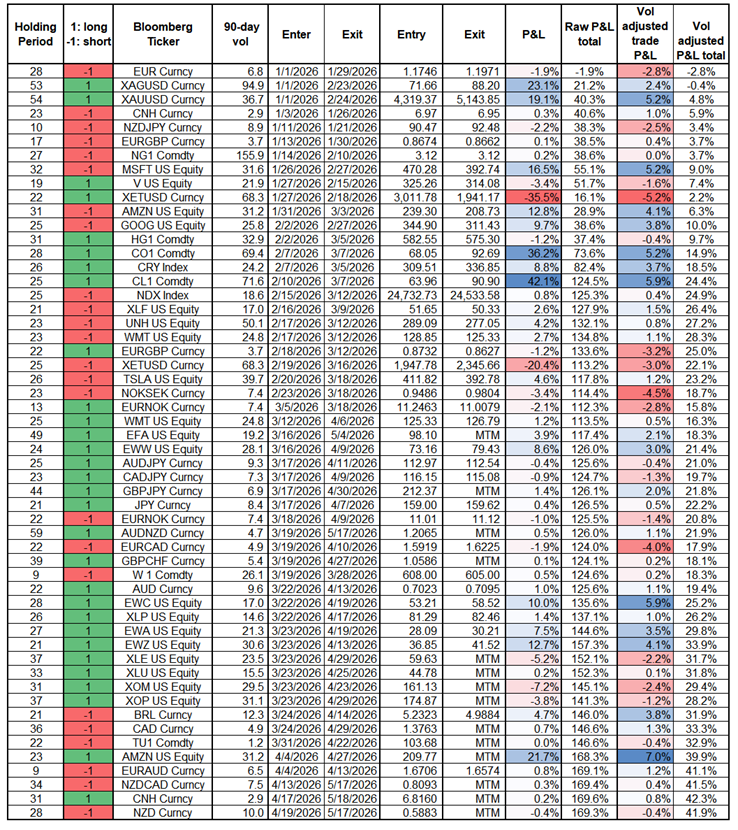
“MTM” simply means the trade hasn’t closed yet so we are marking it to market at current levels. The biggest challenge with trading this systematically is position sizing and risk management because there is no trading stop loss in the matrix as outlined here.
There have been some questions about the divergence between Atlanta Fed’s GDPNow and the NY Fed model. I am a fan of the Atlanta Fed model, not because it necessarily tracks the economy better, but because it predicts the official release better, and that’s what markets trade off. The two models are built differently.
The Atlanta Fed’s GDPNow mimics the BEA’s construction methodology (13 subcomponents, bridge equations from the same source data BEA uses). It’s reverse engineering the official data. The NY Fed nowcast is a dynamic factor model that extracts signal from a broad macro panel. So it is closer to a “what is the economy doing?” forecast than a “what will BEA announce?” forecast.
There are several studies, including one I did in late 2024, that show Atlanta Fed is a better predictor of the Advance GDP release than NY Fed. For example, looking at the two GDPNows vs. economist forecasts… Atlanta was more accurate than economists 57% of the time whereas NY Fed was correct only 47% of the time.
This chart uses only pre-pandemic data, but post-COVID, Atlanta Fed’s superiority increased over NY. Post-pandemic, the NY Fed model was so bad they shut it down in 2021. Eventually, they launched a new one in 2023, admitting that their old model had fundamental flaws. Not super confidence inspiring.
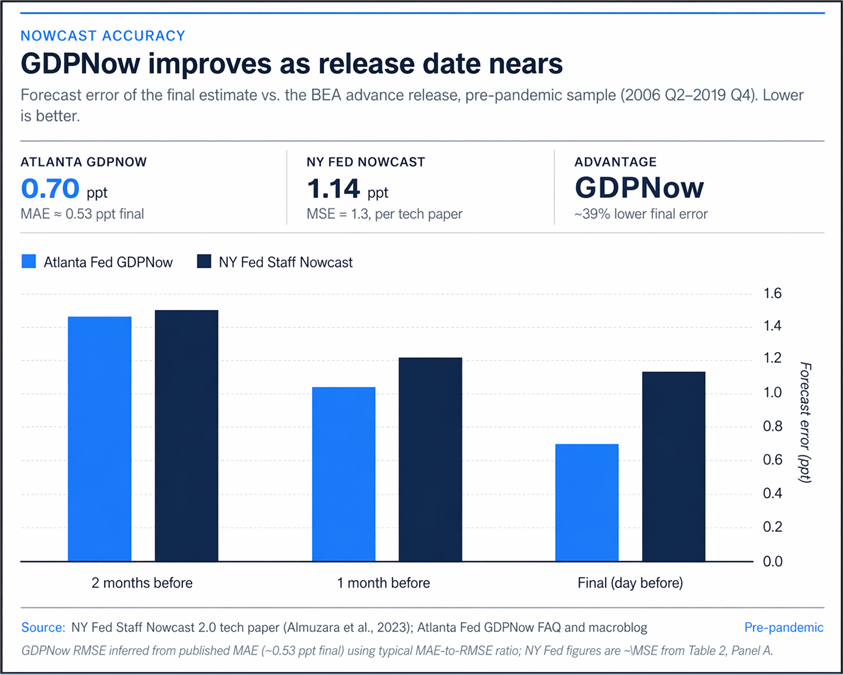
April 30 is the release date for Q1 Advance GDP, so we will see. The bottom line is that it’s not really a fair fight because Atlanta Fed is trying to predict the release, and NY Fed is trying to measure the economy. Therefore, it makes sense that as the date of the release nears, the Atlanta Fed model should more often be most accurate.
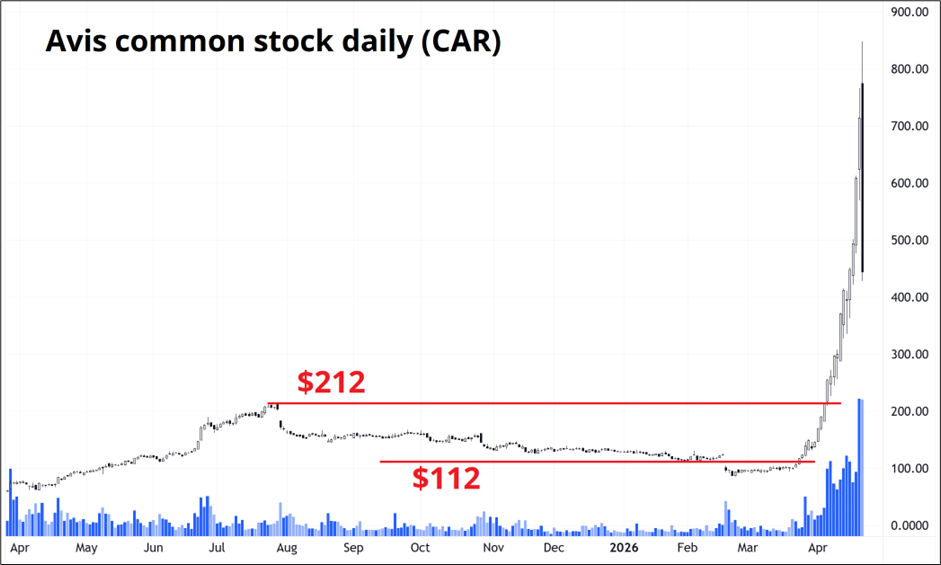
The ghost of Bill Hwang is driving Avis up and down. Yesterday, the stock cracked, losing almost 50%. Fun and stupid fact: Because Dow uses price-weighted indexes… AVIS was around 20% of the entire transport index at one point yesterday…. Double the weight of FedEx, even though FedEx is 3X larger by market cap and was 10X larger than Avis before this short squeeze started. Anyone telling you the breakout in Transports means anything does not know how the index is constructed.
The table here was built yesterday with Avis at $750.
![]()
If you are trading this bringer of tears, the big supports are the old 2025 high ($212) and the important $112 pre-short-squeeze pivot from Q1 2026. This Avis short squeeze will go down in history along with Porsche/VW, Bill Hwang WB, and GME 2021. And Avis 2021 ofc lol. Note those dollar volume numbers are completely insane as the stock traded 20X normal volume with the stock price up 800%.
1. I will be out of the office Friday/Monday/Tuesday for family obligations. am/FX returns April 29.
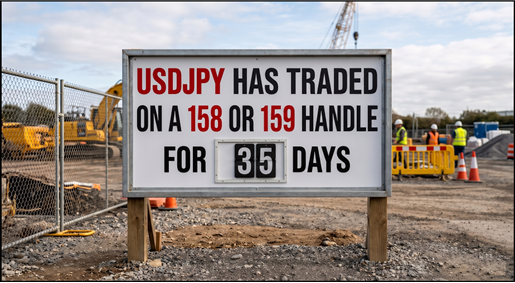
2. USDJPY update.
3. COVID music flashback! I remember watching this on April 20, 2020, as I rode an empty commuter train home. Post Malone and Travis Barker: In Bloom.
There is beautiful ironic genius to Kurt Cobain trolling his own fanboys in the lyrics to In Bloom. See you next week.