An explainer that covers the Spectra FX Positioning and Momentum Report and Big Strikes.
rabbit holes
How to trade the positioning report


Current Views
Short 07APR EURCHF 0.9010/0.8960 put spread +
long 07MAY 0.9110/0.9160 call spread for 2bps
Idea is that EURCHF holds around here due to SNB intervention and then we rally when the war is over
Rabbit Hole #17
How to trade the positioning report
Welcome to Rabbit Hole #17. The Rabbit Hole series offers deep dives into random macro topics that fascinate me. Today: An explainer that covers the Spectra FX Positioning and Momentum Report and Big Strikes. How they are constructed and how I use them to trade.
8-minute read – feel free to forward this piece
SFXPM
Every Monday, we publish two data sets, the Spectra FX Positioning and Momentum Report and a grid of large expiries in EURUSD and USDJPY. I am often asked how these reports are constructed, and how they can be used. Today, I will explain in detail where the numbers come from and how to incorporate them into your trading process. Let’s start with the positioning and momentum report, which looks like this as of today:
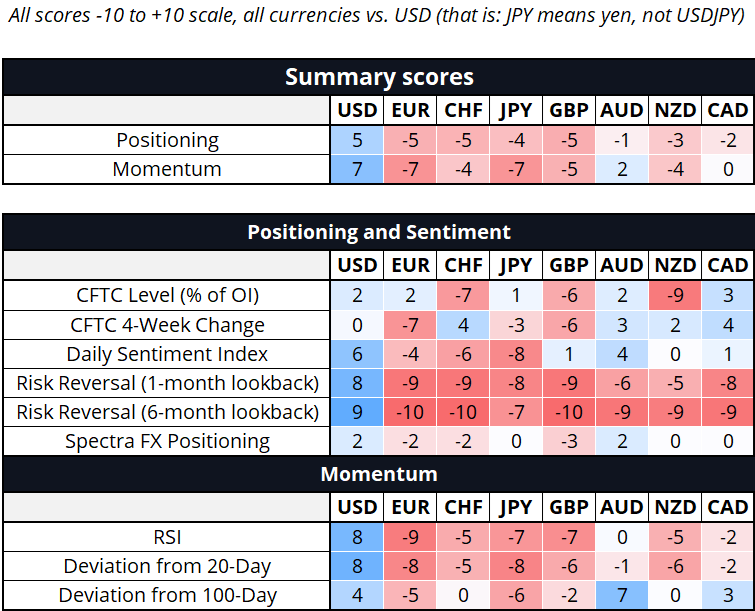
First: What do all the lines mean? The first two lines are summary scores that take the average of the positioning and momentum scores detailed in the section below. These are simple averages. Due to the nature of averaging, and the fact that positive and negative numbers cancel out, you will rarely see an average score above 5. If you do, that’s an extreme. Extremes are the most important thing to look for. Note that all numbers for “USD” are averages of all the currency scores because when you see “EUR” or “AUD” (etc.) that score is always vs. USD.
To give you a sense of how those top line numbers evolve, let me share the historical data for the USD, EUR, and AUD.
Here is the data from 01JAN23 to now…
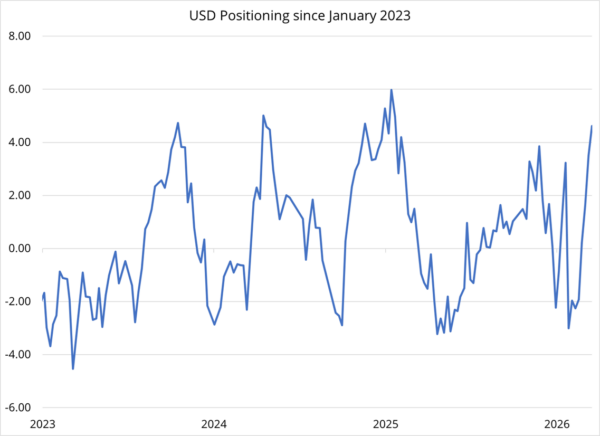
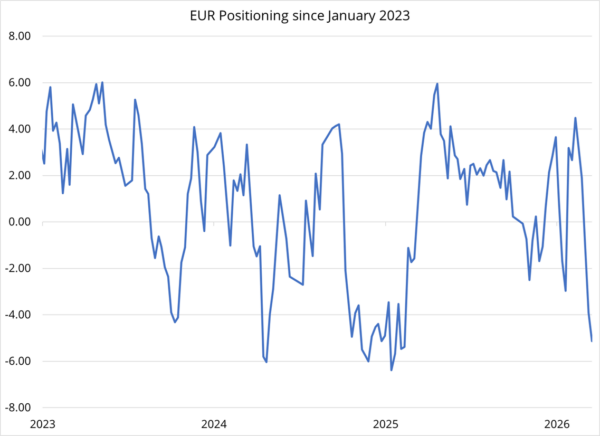
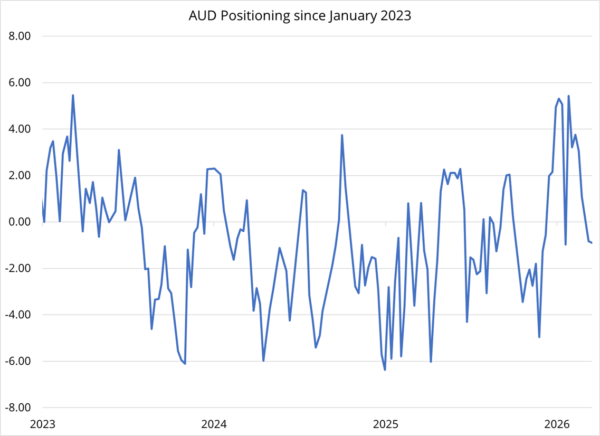
Note that while the scores are all out of 10, you never see the average go beyond 5 or 6. It would be almost impossible to get an average score of -10 or +10 because that would require pretty much every single line item to be -10 or +10. This is an important observation because your intuition might not immediately tell you that +5 out of 10 is an extreme score.
Now, let me go through each line item and explain what it is.
Positioning / Sentiment
CFTC LEVEL uses net non-commercial futures positions as percentage of open interest. Looking back across the sample from today back to January 1, 2000.
CFTC 4-Week Change shows the change in non-commercial futures positions as a percentage of open interest over the past four weeks. Is positioning getting shorter or longer over the past four weeks?
Daily Sentiment Index takes the most recent Daily Sentiment Index data and normalizes it to a -10 to +10 scale. The Daily Sentiment Index is a long-running and oft-cited survey of retail traders. I have been following DSI since the early 2010s, though it has been around since 1987! I find it particularly useful at the most extreme points. Three standard deviation extremes are a good place to take a shot at going the other way, especially if you have other reasons to do so. You can learn more about DSI and subscribe here: https://www.trade-futures.com/dailyindex.php.
For our Risk Reversal metric, we seek to intuit client and dealer options positioning via examining the price action in the volatility surface. The metric is simple—we look at the z-score of the risk-reversal to glean the strength and direction of the signal. For our sampling periods, we use a 1-month and 6-month lookback. The 1-month score is noisier but provides some insight into the “direction of travel” in option flows. The 6-month score reflects more fundamental and structural positioning, as opposed to momentum or tactical trades.
Spectra FX Positioning is our best subjective estimate of positioning based on flows we’ve seen and conversations with clients, plus other data we collect from banks and hedge funds.
Momentum
RSI is the 14-day RSI measure.
Deviation from 20-day is current spot level minus 20-day moving average.
Deviation from 100-day is current spot level minus 100-day moving average.
Finally, as stated earlier: All USD measures are the inverted average of all scores vs. each currency. For example, if every currency was +10, USD would be -10. If all currencies average +5, USD = -5.
Okay, so that’s how we get the numbers. Now what? The first thing I will say here, and it’s important: Positioning is often overrated as an indicator! Price and positioning move together most of the time, and if you are a contrarian who always goes against positioning, you will be fighting every major trend. Below please see our positioning data vs. the price of the DXY.
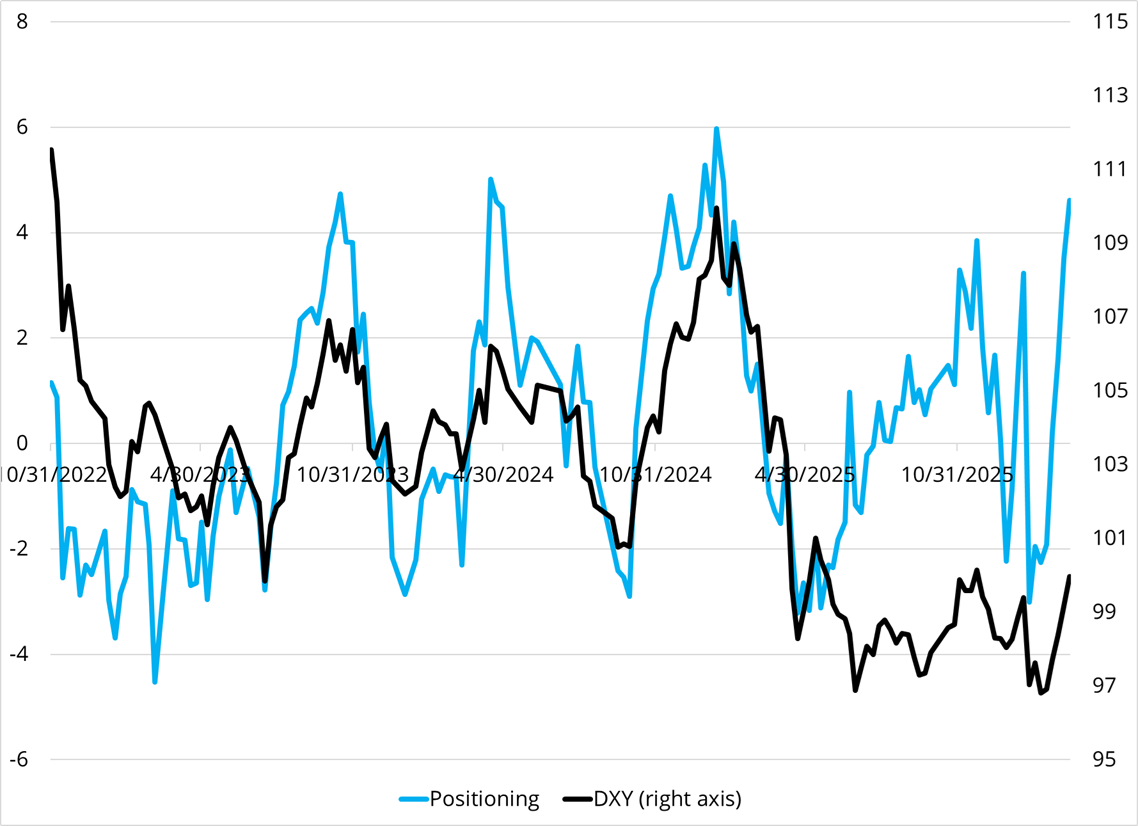
Three things stand out here:
- Positioning and price move together. People like to buy things that are going up and sell things that are going down. If trend following works, this is not a bad strategy, even if it sounds superficially dumb.
- At the extremes, price tends to mean revert and positioning follows. That is, when we get above +5 or below -5, it’s contrarian.
- Positioning has flipped massively due to the war. USD longs are now extreme. We are at the point where one should look for signposts to confirm that initiating a short USD position makes sense.
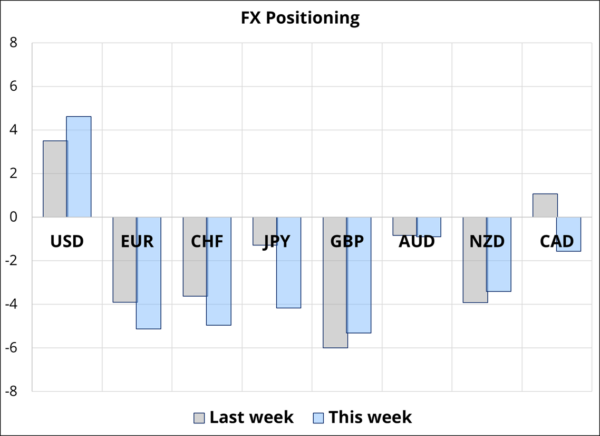
Here’s this week vs. last week:
To trade positioning successfully, you need to think of positioning as the initial conditions of the system. Then, watch for setups that will lead to a big move as large positions reverse, or strong sentiment leads to aggressive adding of risk.
Positioning is packed with potential energy, like fuel for a future fire. Positioning unwinds are like fires. They need heat (a spark or catalyst), fuel (large positions), and oxygen (more bad news, or mark-to-market losses that trigger feedback loops that lead to more position unwinds).
When I was in grade school, they taught us this process with the fire triangle.

Large positions are like piles of dry tinder that can potentially burst into flame at any moment, but probably won’t. Remember, just because you have a large stack of dry wood next to an open can of gasoline… That does not mean there will be a fire.
“You can’t escape the madness of crowds by dogmatically rejecting them… The most contrarian thing of all is not to oppose the crowd but to think for yourself.”
Peter Thiel, Zero to One
Here are five specific ways I trade positioning.
- Play for extreme positioning to burn itself out. The simplest approach to positioning is to wait for 2- or 3-standard deviation extremes in positioning and take the other side. This is a fairly simplistic approach and because it doesn’t factor in any other aspects of the market, it’s my least favorite. I prefer to use extreme positioning as a starting point for investigation and then look for other inputs that will improve my timing or raise the odds of a reversal.
- When extreme positioning aligns with extreme narrative, that’s a similar, but better setup. You saw this recently as the market was extremely short dollars in early/mid-February, and then you got the cover of The Economist announcing the “Dangerous Dollar”. While the Magazine Cover Indicator is one way you can assess extreme narrative, you can also gauge the bank strategists and your inbox to track the narrative around particular currencies. When every strategist in the world was max bullish USD in early 2025, or when they all flipped to bearish and published 1.30 and 1.40 topside targets in EURUSD, those were tells. Extreme strategist consensus and outrageous price targets are a sign of extreme narrative.
- A third catalyst for positioning reversals is an exogenous shock. VAR shocks lead to degrossing, and that reduction in positions is willy nilly and happens with no regard to fundamentals. We saw this recently as the USD ripped higher at the start of the Iran war, gold and silver fell, and bitcoin stayed steady, then rallied. The market was max long gold and silver and close to max short USD at the start of March when the war happened, and so gold’s safe haven status and bitcoin’s past behavior as a risky asset were meaningless. When a major shock hits, you can go down the list of extreme positions and quickly take the other side.
Before we go any further, it is important to understand the difference between positioning and sentiment. Many traders and analysts use the two terms interchangeably, but they are not the same thing. Sentiment is how people view the market. If you take a poll of traders, you will get a sentiment reading. An example of this sort of reading is the Daily Sentiment Index (DSI) published by Jake Bernstein, which is a daily survey of retail futures traders.
On the other hand, positioning is a metric that measures ACTUAL POSITIONS. An example of this type of data is the Commitment of Traders report, which comes out every Friday and summarizes futures positions held by commercial and non-commercial traders. In our report, we have some positioning indicators, and some sentiment indicators.
You can have a market that is extremely bearish but not heavily positioned and this is different from a market that is extremely bearish and extremely short. The difference is that the skew of future moves is completely different in the two situations. A market that is bearish but not yet positioned is primed to go down as people take new positions to reflect their bearish view. On the other hand, a market that is bearish but heavily positioned short is more at risk of a short squeeze or reversal because there could be nobody left to sell.
Why would a market see extreme sentiment but no extreme positioning? There are many possible reasons. For example:
The theme is new. It takes a while for positions in one direction to become extreme. Sentiment moves faster than positioning. Many traders will build into a position as their conviction rises and as new information substantiates their view. As a general rule, sentiment leads positioning because it is faster and easier for a trader to get bearish than it is for her to put on a sizeable bearish trade.
Major event risk upcoming. This is one of the most common and highly profitable setups. Let’s say the market is extremely bearish EURUSD but there is an ECB meeting or nonfarm payrolls coming up. Nobody wants to go into nonfarm payrolls short EURUSD because there is gap risk or event risk if the number is weak.
The moment the number comes out (assuming it is not extremely weak), EUR will drop aggressively as traders put on the trade they wanted to have all along. Traders were simply waiting for the event to get out of the way and did not really care about the outcome of the event. This can lead to surprising moves where you get, for example, a slightly weak US number (which should be bullish EURUSD) and EURUSD drops aggressively because traders care less about the number itself and more about the fact that the event risk is out of the way and now it’s safer to get short EURUSD.
And this leads to the next way I trade positioning:
- Identify moments where the market has a very strong view but does not have the position yet because they are waiting for an upcoming event to pass, you can often profit by simply putting on the position faster than others once the event is out of the way. While sentiment and positioning move together, it is important to remember that they are not always the same thing. Most of the time sentiment and positioning will match fairly closely but it is the times when they do not match that can be most important.
And finally…
- Another way to pick a top or bottom in price is to identify situations where sentiment readings are extreme and then wait for a reversal formation such as a shooting star, bear hammer, or extreme volume spike. This is a great way to trade sentiment because you remain very patient, recognizing that high sentiment readings are a standard part of a bull market; then when you see a bearish technical setup, you pounce. Quite often a massive volume spike at a price extreme will be an important tell and when it happens in a world where positioning was already 2 or 3 standard deviations extreme, that’s a 5-star setup.
A few more notes on positioning
- Positioning often leads price at turning points. Keep on the lookout for moments when price and positioning diverge. This is an early warning that a long-running and crowded trend is ready to turn.
- Positioning can trend for a long time. In FX, there are periods where the market is positioned the same way for a year or more. This has not been the case recently, however, as policy confusion has led to many changes in USD direction and positioning.
- Absolute levels of positioning mean less than the rate of change of sentiment and/or positioning. Here is my basic positioning and sentiment framework:
When you hear someone say that positioning is extreme, don’t get too excited. Usually all that means is that the market is in a strong trend. Ask more questions: Can positioning get more extreme? How long has it been extreme? Is the price continuing to go in favor of those who are positioned with the trend (i.e., do price and positioning confirm each other?) Are the variables and narrative that led to the big position still in play? Or are the fundamentals changing? What upcoming catalysts could lead to a turn in positioning?
Simplistic views of positioning will always suggest that you take the other side but rarely is that approach profitable because trends can last many months or even years. Most research shows that it is generally more profitable to go with COT positioning, not go against it.
While positioning data are important, my experience over the years is that well-informed observation can be more useful than any quantitative analysis of positioning. As a market maker, I have often noticed that you can get a good read on positioning by the number of enquiries you get as the market moves. You can get the same vibe on Twitter.
If people are generally asking “what the??” about a move, or saying the move is “stupid” or “dumb” or “ridiculous” you can assume they are not on the winning side of the move. Similarly, if you are at a hedge fund and you get 11 different “BUY USDCAD!” recommendations in your inbox; you should probably hit a bid. The deeper your involvement in the market and the greater your experience level, the better your sense of positioning and sentiment.
To summarize:
- Extreme positioning (> +/- 5) is a good starting point when looking for contrarian trades but…
- You want another reason to do the trade, e.g.:
- Narrative is extreme
- Crazy price targets are coming out of the woodwork
- Technical reversal (shooting star, volume spike at price extreme, etc.)
- Exogenous event triggers position unwind/degrossing
- New catalyst or news that goes against the prevailing theme
- Or, in contrast, look for times when sentiment is strong, but positioning has not yet reflected sentiment.
How I use the Big Strikes Report
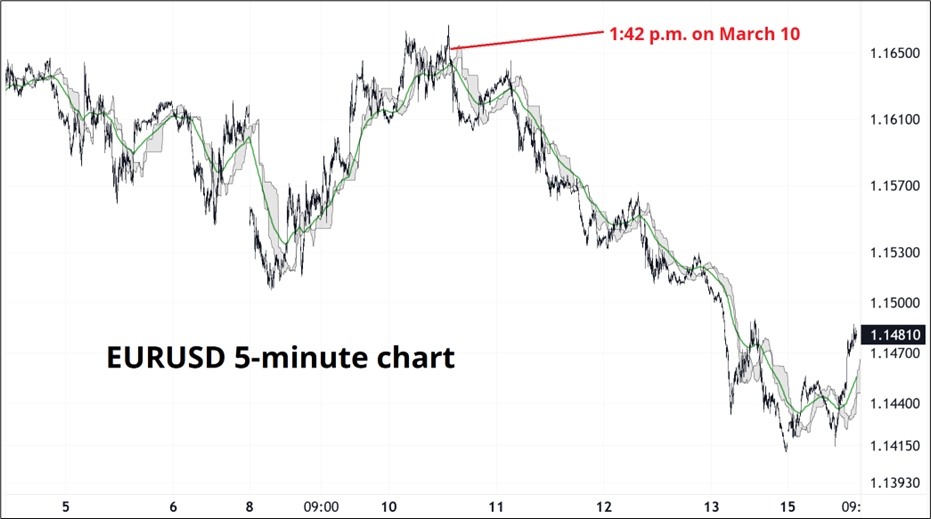
Big strikes are extracted from Bloomberg’s OMST feature (e.g., EURUSD Curncy OMST {GO}). Market makers mostly hedge dynamically, while owners of options do not. This is a generalization, but it’s true enough to be a good heuristic. Therefore, when spot moves close to a major strike, there is more likely to be flow in that area from owners of options. Last week, we got a perfect example of this when EURUSD was 1.1650 and the Big Strikes report showed billions of euros worth of strikes 1.1650/1.1700. At that time, I posted to my client chats (1:42 p.m. on 10MAR):
It looks to me like oil is basing and there are billions of strikes 1.1650/1.1700 so you have a pretty decent zone to sell into here in EURUSD. The big dump lower on March 2 started from 1.1690/00 as well, and 1.1740 is old support now resistance. so short EURUSD here with a 1.1757 stop is good. Or sell 1week call spreads to buy put spreads etc.
Here’s the expiry report and EURUSD chart from that day.
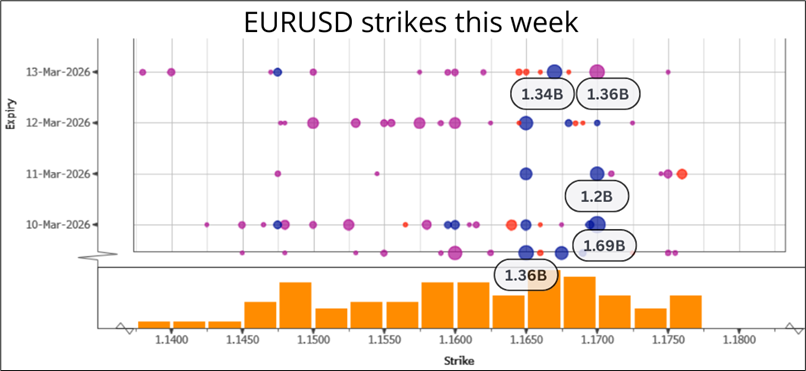
This is a good example of how you can use big strikes as support or resistance. As with any trade I ever do, there is not a single input here. I am not just seeing the big strikes and selling there. I have a view based on some other factors and use the strikes as another input, similar to how I would use technical analysis.
The other way to use the big strikes is to remember that as 10:00 a.m. approaches, the strikes will tend to create gravity as pin risk rises near expiry. Imagine I own 2 billion of a 1.1500 EURUSD put and EURUSD falls from 1.1550 to 1.1490 at 9:30 a.m. I will start buying euros to hedge the expiry because the option is going to expire soon. Say I get 300 euros at 1.1490 and it rallies to 1.1510. Now, I am a seller. As 10:00 a.m. nears, I want to extract as much as I can from the strike and I will keep buying and selling below and above 1.1500 until 10:00 a.m. This is called “strike gravity” and it’s why the big strikes often get pinned.
The final outcome here is that after 10:00 a.m., spot is free to go where it wants and so sometimes you will see big directional moves once the strikes roll off.
To summarize:
- Big strikes work much like technical levels (support and resistance).
- Big strikes are magnetic as 10:00 a.m. nears.
- After expiry, you sometimes get zippy moves in the direction the market wanted to go before, but could not, because it was pinned.
And here is this week’s Big Strike report. Lots of stuff sub-1.1400 for Friday.

Thanks for reading. Feedback and criticism welcome. Calendar below.
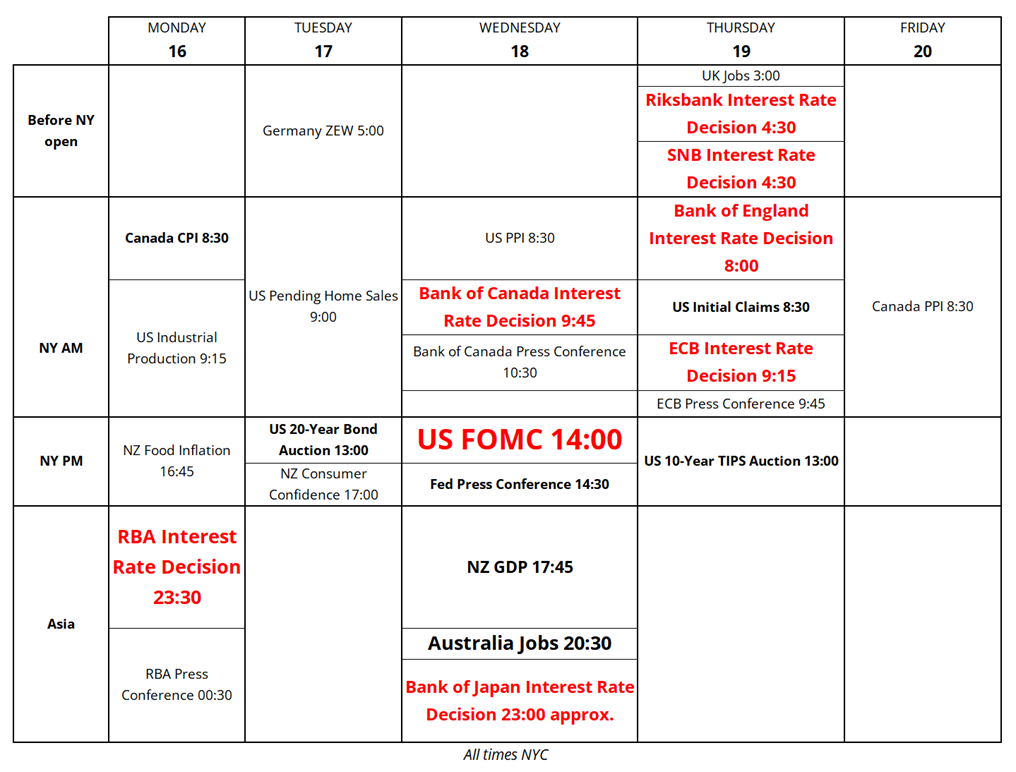
This week’s trading calendar