September 14, 2023
Stocks
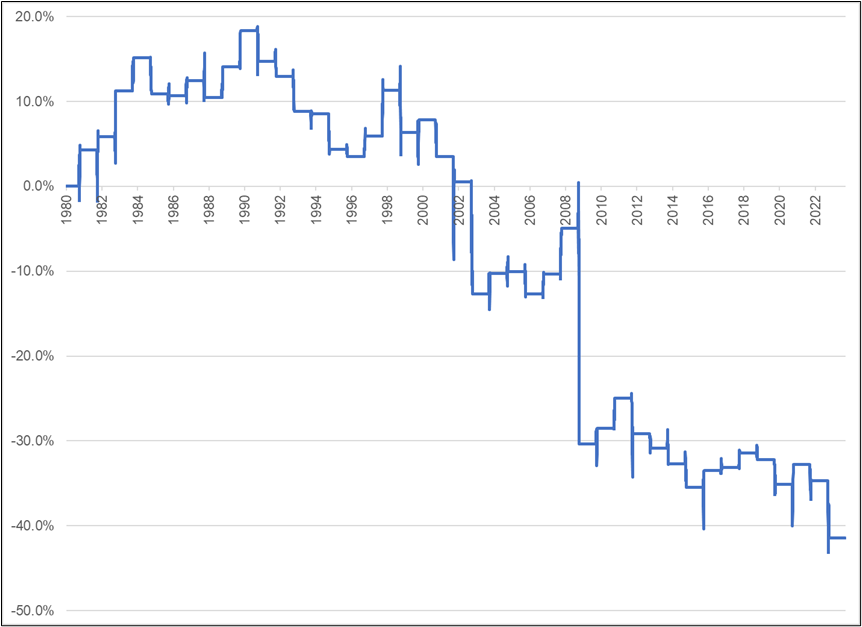
As you probably know, we are entering the worst period of the year for stocks. This is a period where you go from the SPX normal win rate of 53% to nearly a month where the daily win rate is 48% since 1980. That sounds small, but it adds up and creates one of the few windows of the year where the EV of long stocks is negative.
This of course, assumes you believe that seasonality works out of sample, which I do. Still, it’s a clue, not the answer to stocks as there are plenty of times the market goes up in that window as you can see from 1980 to 1990, for example.
Running P&L of long S&P 500 from September 16 to October 9
1980 to now
The ugly AAPL chart lends a bit of zing to the bearish megacap view right now and NVDA’s lack of forward progress, plus the cooling of the AI mania, create fertile conditions for a correction.
You can see below, the top panel shows Bloomberg stories containing the words “artificial intelligence” while the bottom panel (x-axis dates lined up with top panel) shows Google searches.
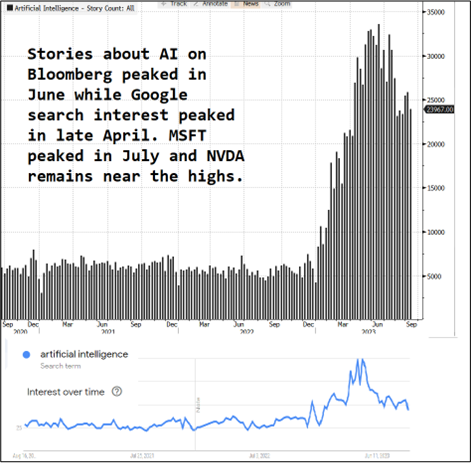
We saw with the crypto mania that search interest tends to peak a few months before the related securities peak. The resumption of student loans may also encourage around 45 million Americans to rein in their gambling habit in AI, crypto and 0DTE. Here’s Apple:
AAPL: Bearish
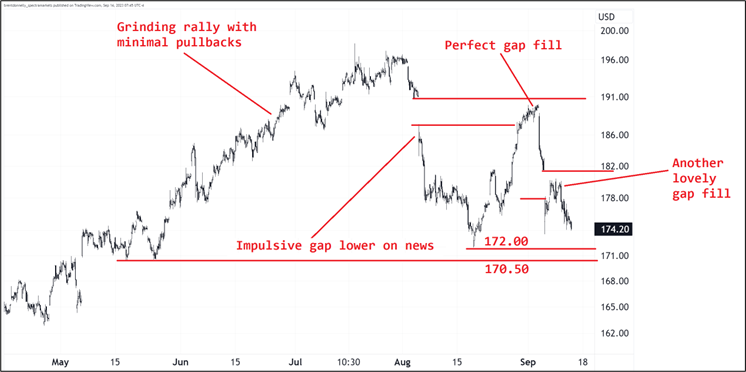
Two perfect gap fills have kept the bulls on their heels and now 170.50/172.00 (the May 2023 double bottom and mid-August lows) is key. Through 170 opens up a zippy move into the 150s. MSFT continues to hold well below the volume spike on the AI pricing news which took it briefly to 366. I would lean short megacap now until mid-October as the charts and seasonality come together to suggest downside pressure.
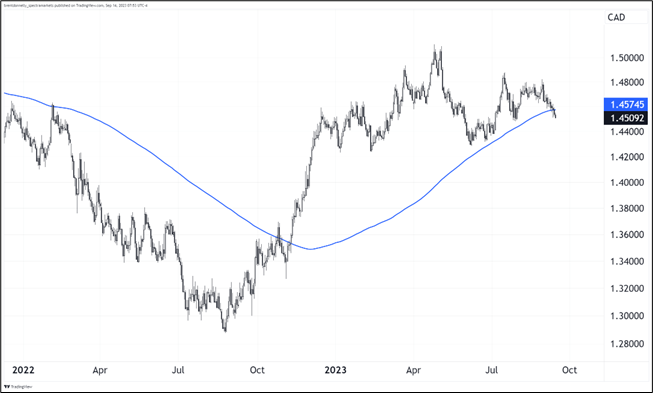
CAD
Nobody has been talking about CAD of late as the BoC doesn’t seem to matter, the data is mixed, and oil doesn’t matter either. Now, it held the top of the range perfectly on the most recent surge in the dollar and it’s starting to flash green on many people’s radars. The cross of the 200-day in EURCAD has generated some attention and if the US is still OK and oil is at $90 while Europe is in recession and the UK stagflation story picking up… CAD looks half decent.
EURCAD vs. 200-day MA
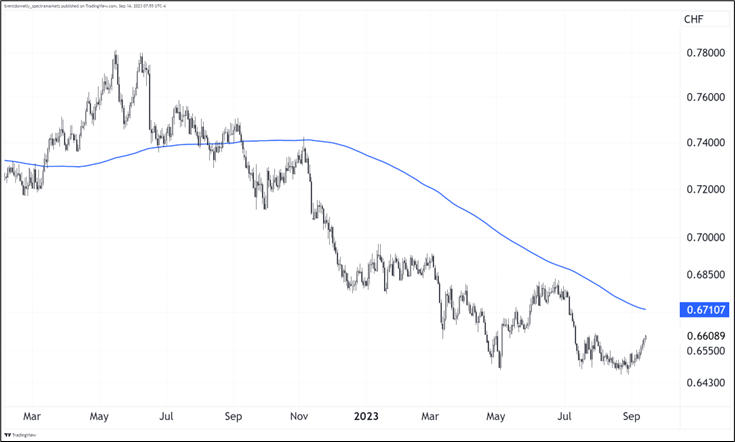
The CADCHF chart is also a looker as it forges a lovely double bottom.
CADCHF vs. 200-day MA
Not much has changed on the fundamental macro side in Canada of late but the charts are looking interesting so I would at least have CAD on your radar. Often when it starts trading well on the crosses, that’s a sign of good health. With my mildly bearish equity view, though, long CAD doesn’t make particular sense for me right here right now.
Final Thoughts
This article is making the rounds for good reason. It’s a solid explanation of the bull case for the US. I am a bit troubled by how it’s suddenly become obvious that rate hikes don’t matter for the US economy (because fiscal runs the show and monetary policy is impotent), whereas not one person was saying this before (i.e., hindsight explanations are less useful than ex-ante explanations)…
But still, it’s a good note that makes a ton of sense and pushes back on the evergreen “recession is around the corner!” crew. And there is plenty of evidence from the 2010 to 2020 period that monetary policy doesn’t really do that much and has zero impact on inflation. Good article, well worth your time. Strong recommend.
https://nexteconomy.substack.com/p/the-three-blind-spots
Two years ago today, I published the first am/FX at Spectra Markets. It’s been an amazing 24 months and I want to thank you for reading my notes and for all the feedback, and useful criticism over the past 730 days. I truly appreciate that I get to write every day and that you have elected to read my thoughts. Big thanks to Scott and Matt for bringing me over here and to Justin for making my daily work life so much more enjoyable.
I look forward to the next few years as things keep getting better and better.
Have a Kentucky Fried day.
good luck ⇅ be nimble