We are in a period of equilibrium here with the September FOMC meeting priced for a rate cut and the dispersion around that view rapidly narrowing.
Hello. It’s Friday. Thanks for signing up. I’m Brent Donnelly.

We are in a period of equilibrium here with the September FOMC meeting priced for a rate cut and the dispersion around that view rapidly narrowing.

Hello. It’s Friday. Thanks for signing up. I’m Brent Donnelly.
Here’s what you need to know about markets and macro this week

Before we get started, check out this trading challenge from Gelber Group.
Spectra has no official affiliation with Gelber, but I have known these guys for almost twenty years and thus I am happy to promote their discretionary futures and FX trading competition. I am sure this will be of interest to many of my readers, especially those on the retail and prop side. Looks like fun and you can win $35,000 in prizes and maybe even a trading job at Gelber.
Let’s go!
https://www.gelbergroup.com/thebreakout/
Not a lot has changed on the macroeconomic front as we are in a period of equilibrium here with the September FOMC meeting priced for exactly 100% of a rate cut and the dispersion around that view rapidly narrowing as Godot is finally going to show and the Fed is gonna go, probably before it starts to snow.
On the political front, this happened:
If you believe in some sort of quantum multiverse, there are a multitude of timelines where Trump’s would-be assassin was apprehended before he got off a shot, there are many timelines where Mr. Trump has died, and there are just a tiny, tiny few timelines where Donald Trump’s ear was hit by a bullet, but it was only a glancing blow and he survived to stand up and yell: “Fight, fight, fight!” like a trooper.
We live in one of those timelines.
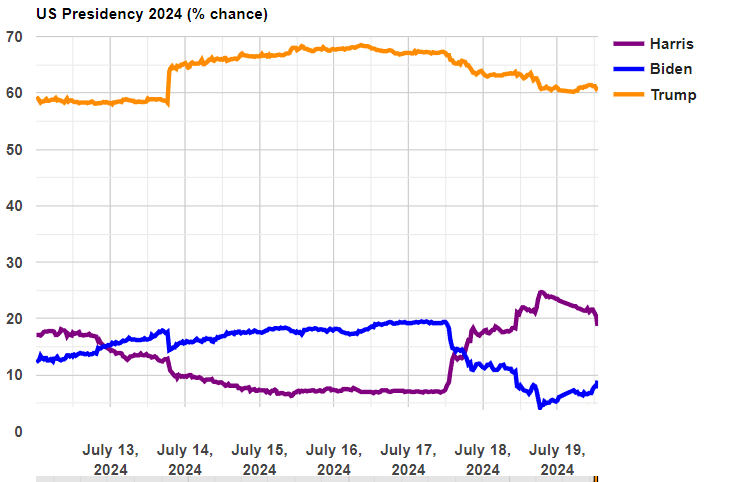
As such, Trump’s odds moved even higher after the weekend assassination attempt which contrasted with the White House announcing:
Note from the President’s Doctor:
The President presented this afternoon with upper respiratory symptoms, to include rhinorhea (runny nose) and non-productive cough, with general mailaise [sic].
I am aggressively apolitical, and cannot vote in the USA (because I’m a Canuck), but the contrast between that White House announcement (which still includes a spelling mistake 72 hours after it was published) and the former President, on stage, dripping blood after getting strafed by an AR-15 and taking an indirect hit to the ear from a bullet at 1000 miles per hour is kind of… Wow.
You can see in the chart that as the noise around Biden’s exit picked up this week, Trump’s odds fell back and are again close to pre-attack levels. The trades that are universally liked for a Trump victory (and accelerate on a Red Wave) are steepeners and long crypto. We will talk about those in their respective sections, OK? Calm down. We’ll get there.
Before we get into all the idiosyncratic and interesting stuff that went on in the various asset classes, a quick recap of two economic highlights this week.
Retail Sales in the US came in much stronger than expected. Once again, the bearish dream of a collapsing consumer remains elusive. Even with excess savings spent, the employment and wage growth situation remains strong enough for consumers to continue to consume consumables at high levels of consumptive consuming consumption.
This chart tracks how strong or weak Retail Sales have been over time, relative to economist forecasts. Using actual minus expected data each month, you can see that from 2014 to COVID, Retail Sales were very consistently weak and after COVID, they have been strong to very strong. This trend of stronger-than-expected Retail Sales peaked at the end of 2023, but started up again quite strongly on this week’s release.

The US song remains the same: Goldilocks soft landing with immaculate disinflation until further notice. And a Fed rate cut in September all but locked in.
I remember in early 2000, a smart friend of mine who works at a consulting firm called me and said: “You gotta buy Oracle. Every single one of my clients is buying their products like crazy! Amazing company!” That was the thesis. Good company, buy the stock. Most people in financial markets will recognize this kind of statement as being wildly first derivative because the caller had no idea where the stock was trading, what the price/sales was, or anything. People back then quoted Peter Lynch’s: “Invest in what you know” as if that was the sole criteria he used to evaluate investments. It wasn’t.
Anyway, you know what happened to Oracle stock afterwards. Now, smart people are starting to wonder if AI can actually make money and peak optimism on NVDA may be here. But that’s not why I bring up the Oracle story. I mention it because of a paper called: “Mental Models of the Stock Market” which shows how most retail investors do not understand the concept of “priced in”.
Verdad, a publication I am not familiar with, published a good summary of the paper here.
The full PDF of the paper is here. Here is the abstract:
Investors’ return expectations are pivotal in stock markets, but the reasoning behind these expectations remains a black box for economists. This paper sheds light on economic agents’ mental models – their subjective understanding – of the stock market. We conduct surveys with the general population, retail investors, financial professionals, and academic experts. Respondents forecast and explain how future returns respond to stale news about the future earnings streams of companies.
We document four main results. First, while academic experts view stale news as irrelevant, households and professionals often believe that stale good news leads to persistently higher expected future returns. Second, while academic experts refer to market efficiency to explain their forecasts, households and many professionals directly equate higher future earnings with higher future returns, neglecting the offsetting effect of endogenous price adjustments.
Third, additional experiments with households demonstrate that this neglect of equilibrium pricing does not reflect inattention to trading or price responses but rather a gap in respondents’ mental models: they are unfamiliar with the concept of equilibrium. Lastly, we illustrate the consequences of equilibrium neglect. We use panel data on household expectations to show that equilibrium neglect predicts previously documented belief anomalies such as return extrapolation and pro-cyclicality.
This big red, green, and blue chart summarizes the findings of the paper. The chart shows six investor segments. Blue bars indicate the proportion surveyed who believe that 4-week-old news about a company is meaningless for the future price of the stock. Green bars are people that think 4-week-old good news is now bearish (mean reversion theory). Red bars indicate the proportion that believe 4-week-old good news would still be a reason to buy the stock today. The sea of red probably explains some of the momentum factor in stock markets.
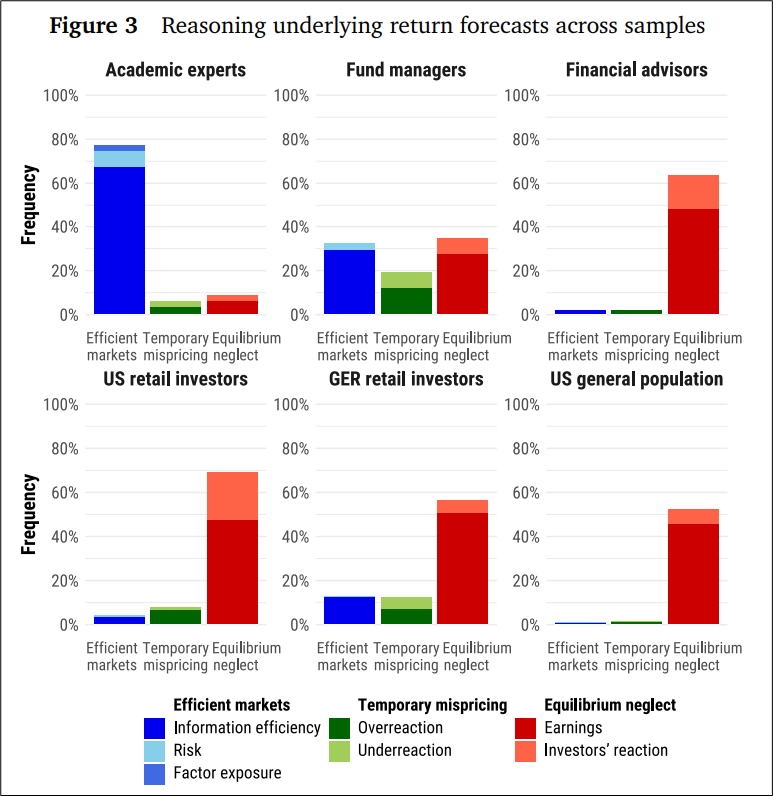
Given that momentum is a real thing in many markets, retail investors who assume 4-week-old information still matters for stock prices going forward are perhaps not totally wrong! But they are probably more wrong than right. While fund managers do OK on this test, financial advisors are just as bad as retail investors and don’t seem to understand the idea of equilibrium or “priced in”.
I do not think that these people in the red bars are actively taking the view that EMH is not valid. They are just using first derivative thinking.
The entire paper is solid and if you don’t have any big weekend plans, the bibliography offers many other worthwhile papers.
Anyway, there you go. If you take “Think Like a Market Professional” you will learn to think beyond the 1st derivative and into the second and third derivative over time.
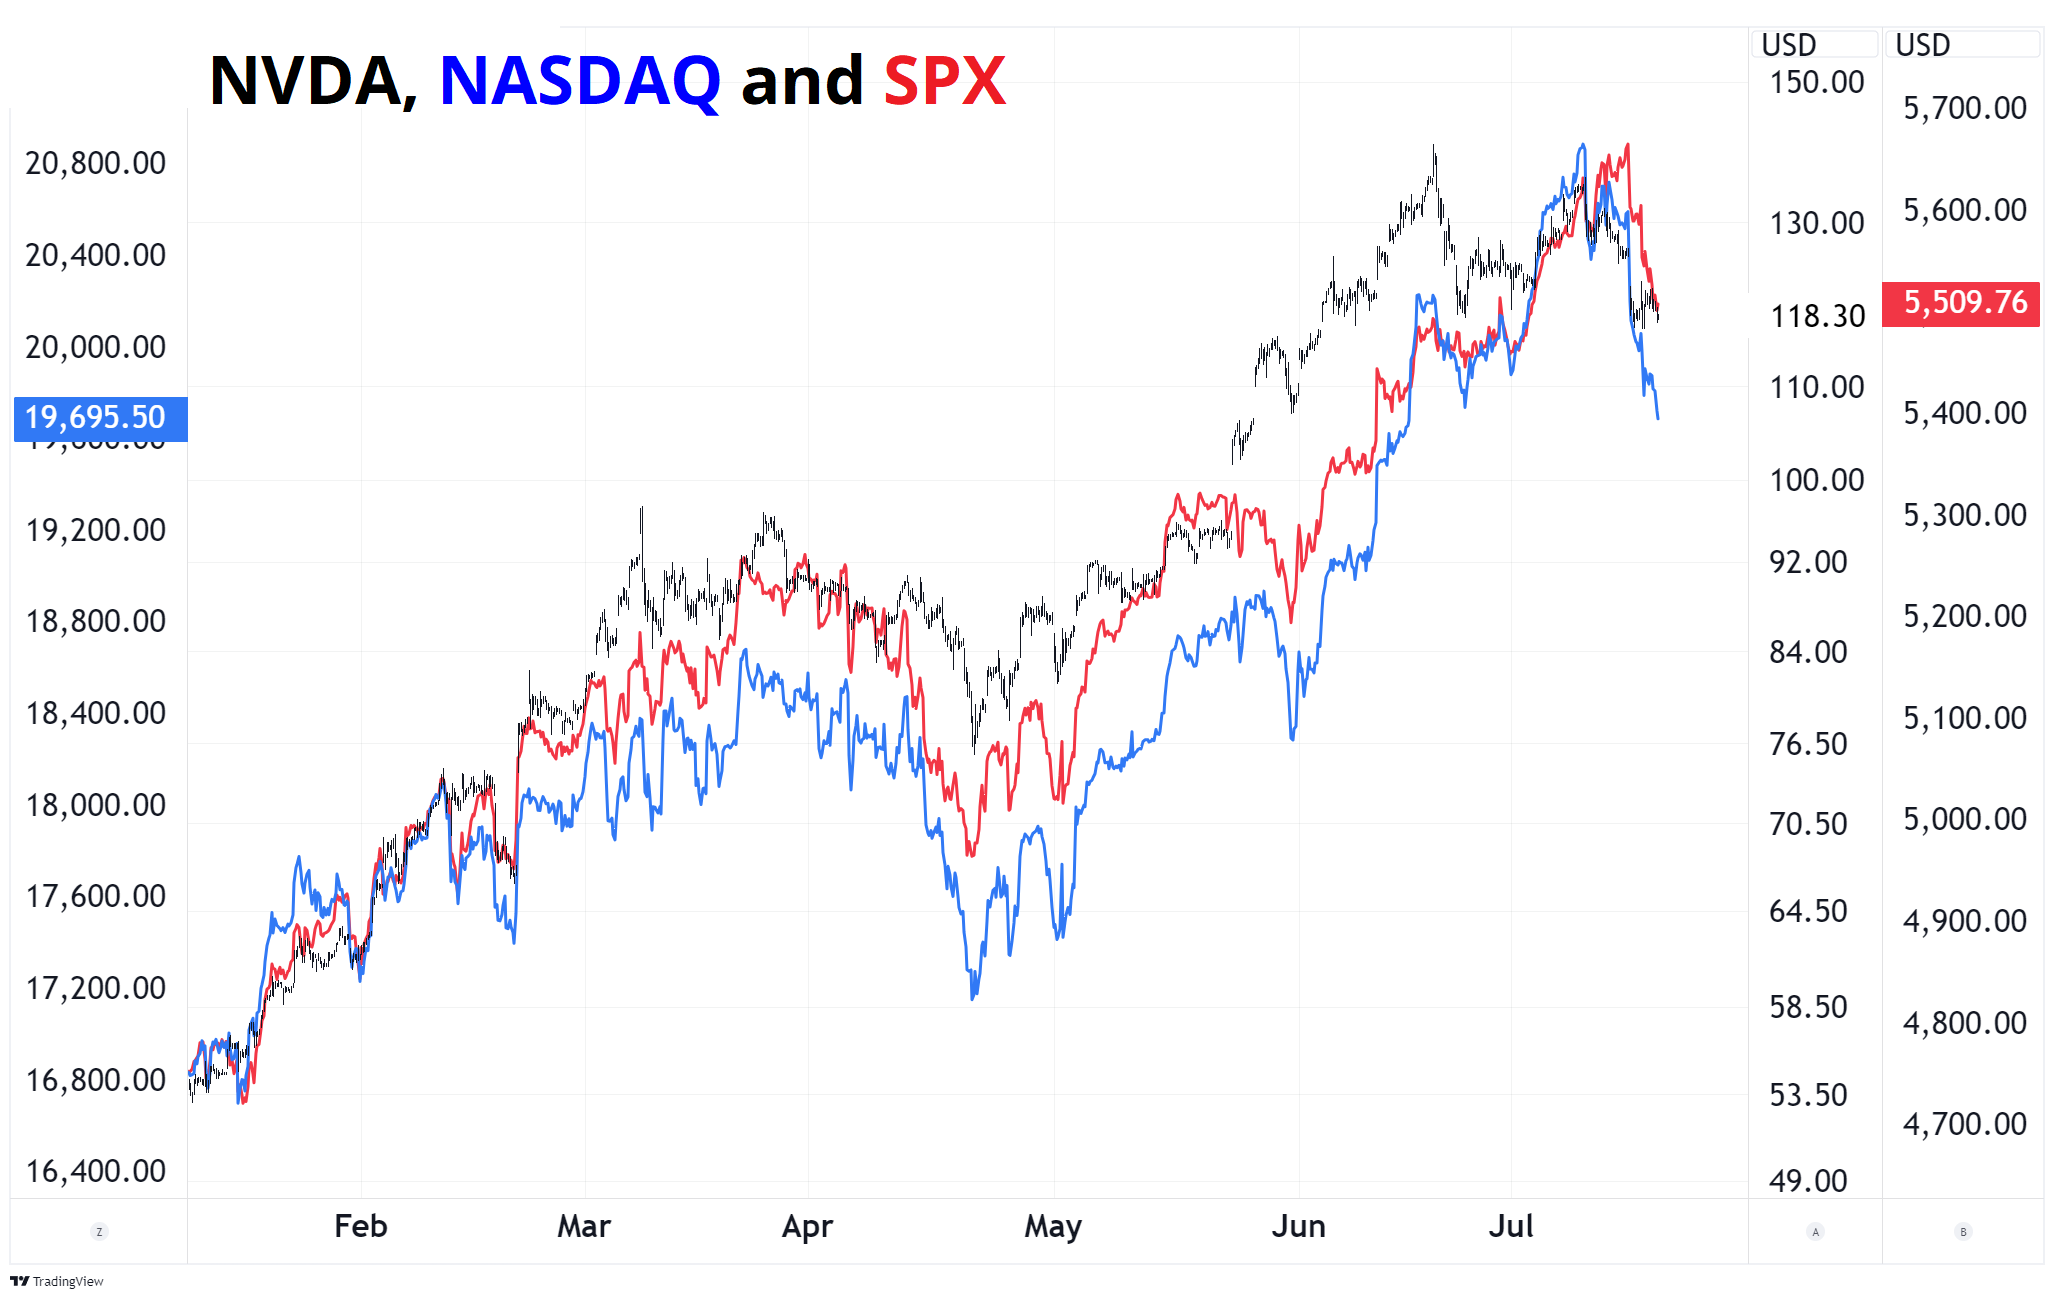
Moving to the here and now… There was an explosion in US stock markets this week as the market got a friendly reminder that momentum trading works both ways. Nobody buying NVDA at 40X earnings or indexes at 40% tech weighting care much about fundamentals or companies anymore. They might say they do, or tell their bosses they do, but what they are really doing is following momentum. So when momentum turns, whether the fundamentals have changed or not, many punters look for an exit.
While there was no proximate catalyst for the multi-sigma unwind of tech and hoovering of other random sectors, I would bet that GS report on AI, and Ed Zitron’s recent posts have made a few people nervous. It’s unusual for a large investment bank to publish bearish thoughts and it’s even more unusual for them to bring an MIT prof with them while doing so. You can read the piece from late June right here:
And two great Ed Zitron pieces on AI
https://www.wheresyoured.at/pop-culture/
https://www.wheresyoured.at/put-up-or-shut-up/
My model of the narrative arc from Alpha Trader goes like this:
If I had to guess, I would say we are early in Stage 6 right now as the GS piece outlines many good points. I see NVDA as similar to CSCO in 2000 or the commodity exporters, 2011-2013. You get one massive buildout of the tech, and then it’s kinda done. LLM’s are running out of training data and anyone assuming Moore’s Law applies to everything in AI is probably overly simplifying things. I use Bard, Claude, Perplexity, and GPT-4 and they are basically free, interchangeable commodities. If LLMs are a commodity and they are not a path to AGI, then the NVDA story could be more cyclical than structural.
Here is this week’s 14-word stock market summary:
When indexes are tech proxies, rotation hurts.
When indexes are tech proxies, rotation hurts.
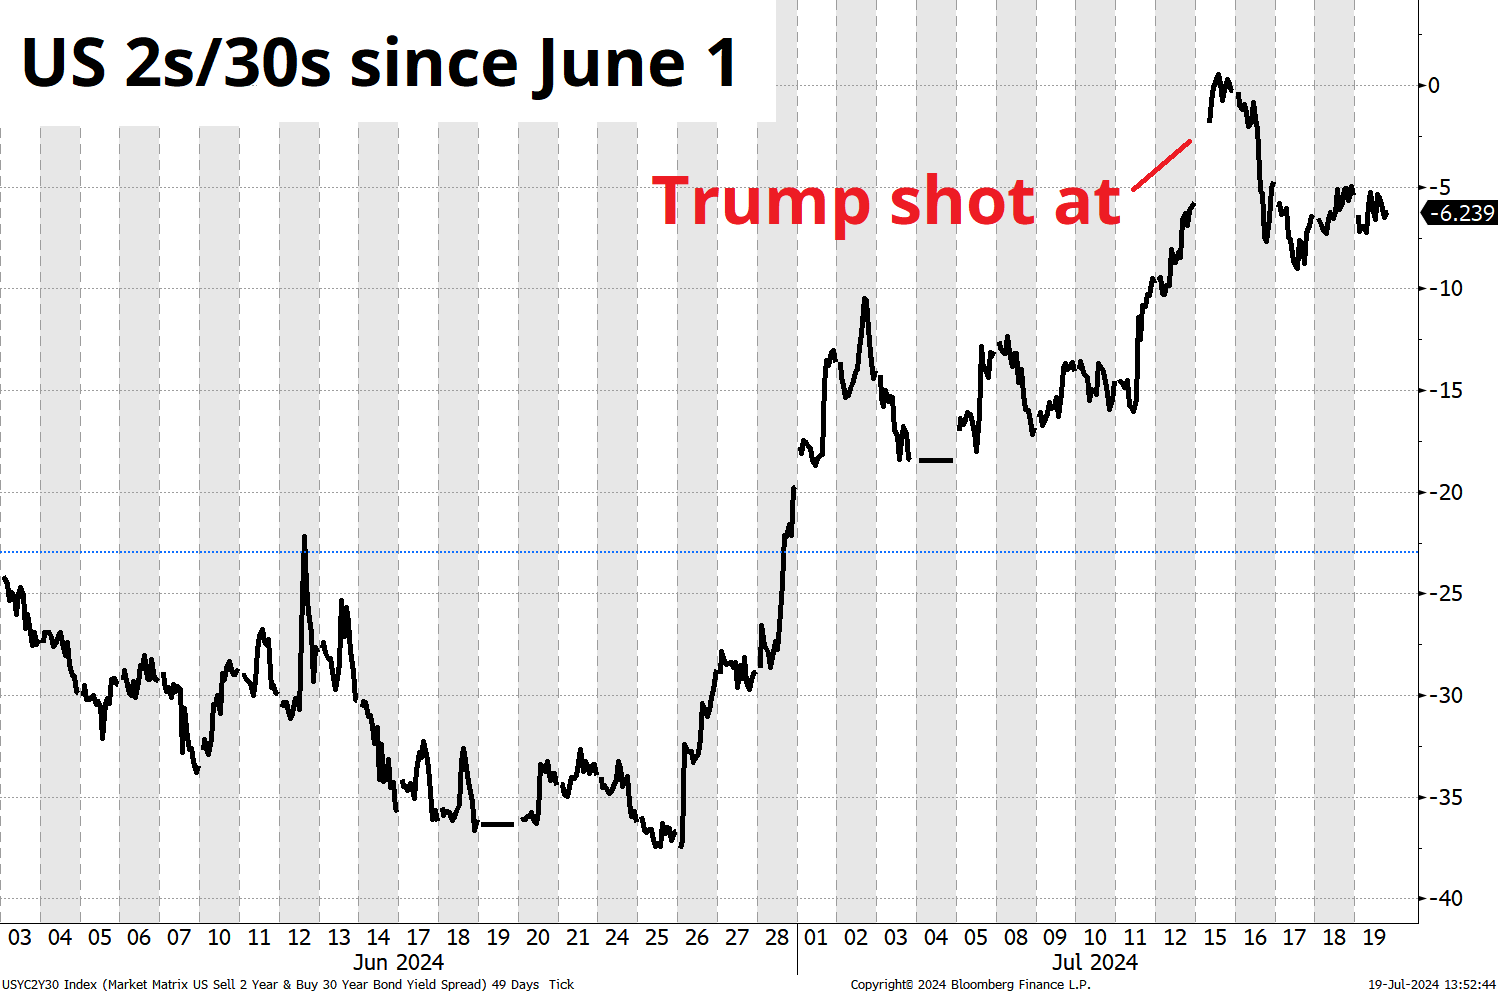
As discussed, the September rate cut is locked and loaded. 10-year yields ticked up this week, but have been quiet. There has been pronounced steepening of late and Trump’s rising odds of victory after the assassination attempt drove another narrowing of the inversion between 2-year and 30-year yields in the US. You can see in the chart that the initial post-weekend gap filled pretty quick and after briefly disinverting, 2s30s are unchanged this week.
The theory is that Trump will run MMT-like (stimulative) fiscal policy while pressuring the Fed not to hike rates (or cut rates more). The inflationary side of Trump’s policies is clear to me but I am not as convinced that he will have much influence on the Fed. Maybe he will. I’m not sure.
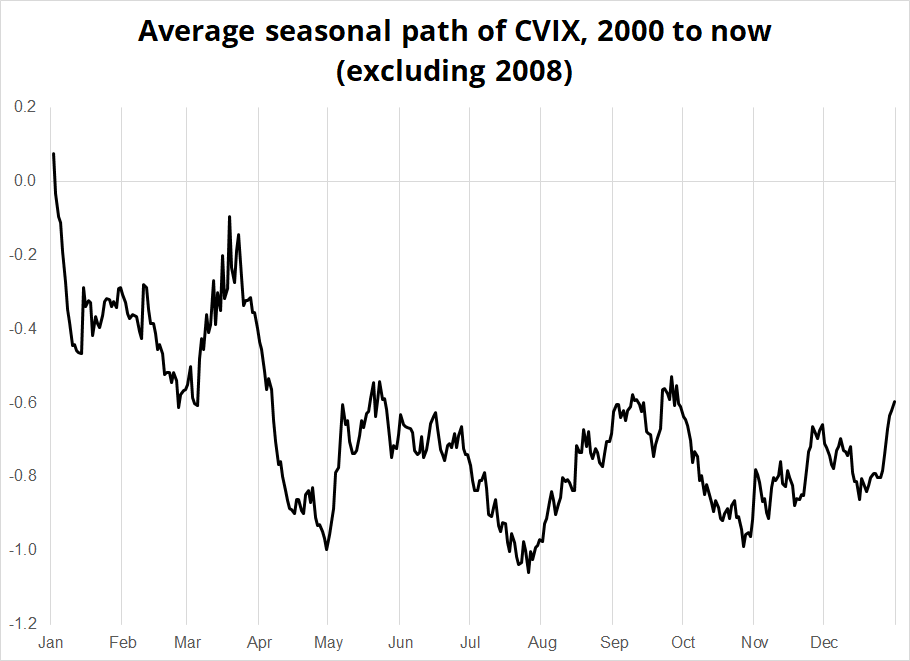
We are in a very interesting moment here for FX as the immediate future shows very little uncertainty as disinflation, soft landing, and a September cut from the Fed are pretty much locked in, while the outlook past October/November could not be any more uncertain. We have no visibility on who is running against Trump, or what the election winner’s policies will be (fiscal, tariffs, Fed, etc.)
This, just as we run into the seasonal bottom for FX vol.
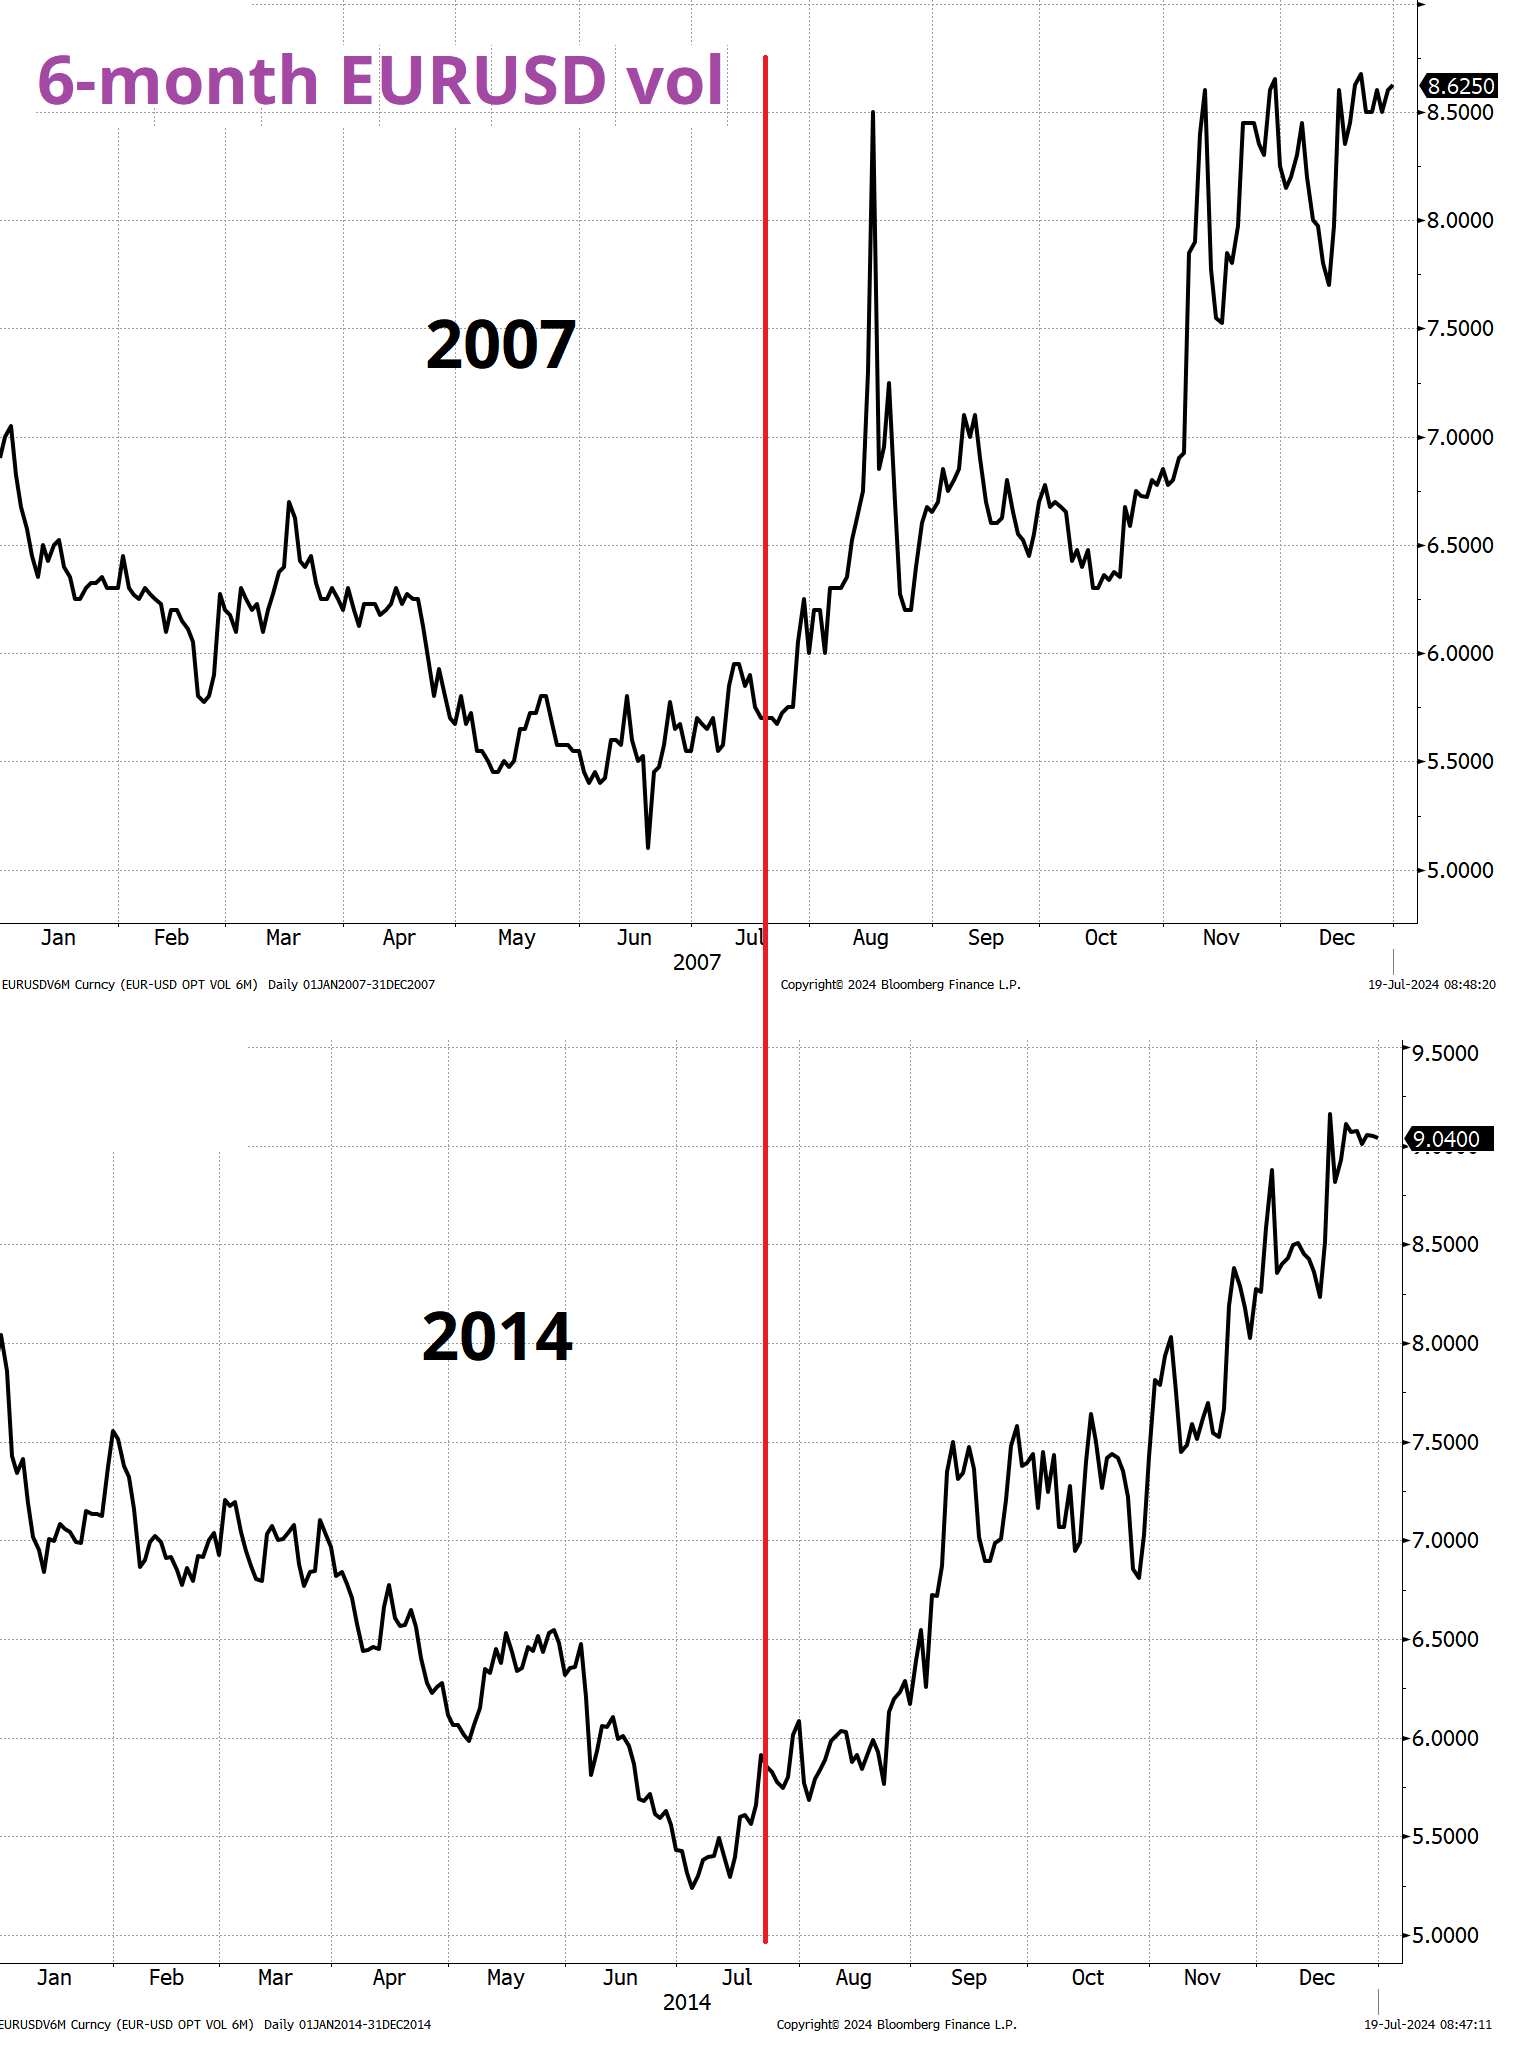
It all feels a lot like 2007 and 2014, when we saw extreme summer doldrums followed by a huge jump in volatility. This chart shows how 6-month EURUSD volatility moved in those years (red vertical line marks 19JUL).
I mentioned short NVDA / long BTC last week and that trade has been en fuego as the booming odds of a Trump victory portend easier crypto regulation and an easier path to widespread adoption over time.
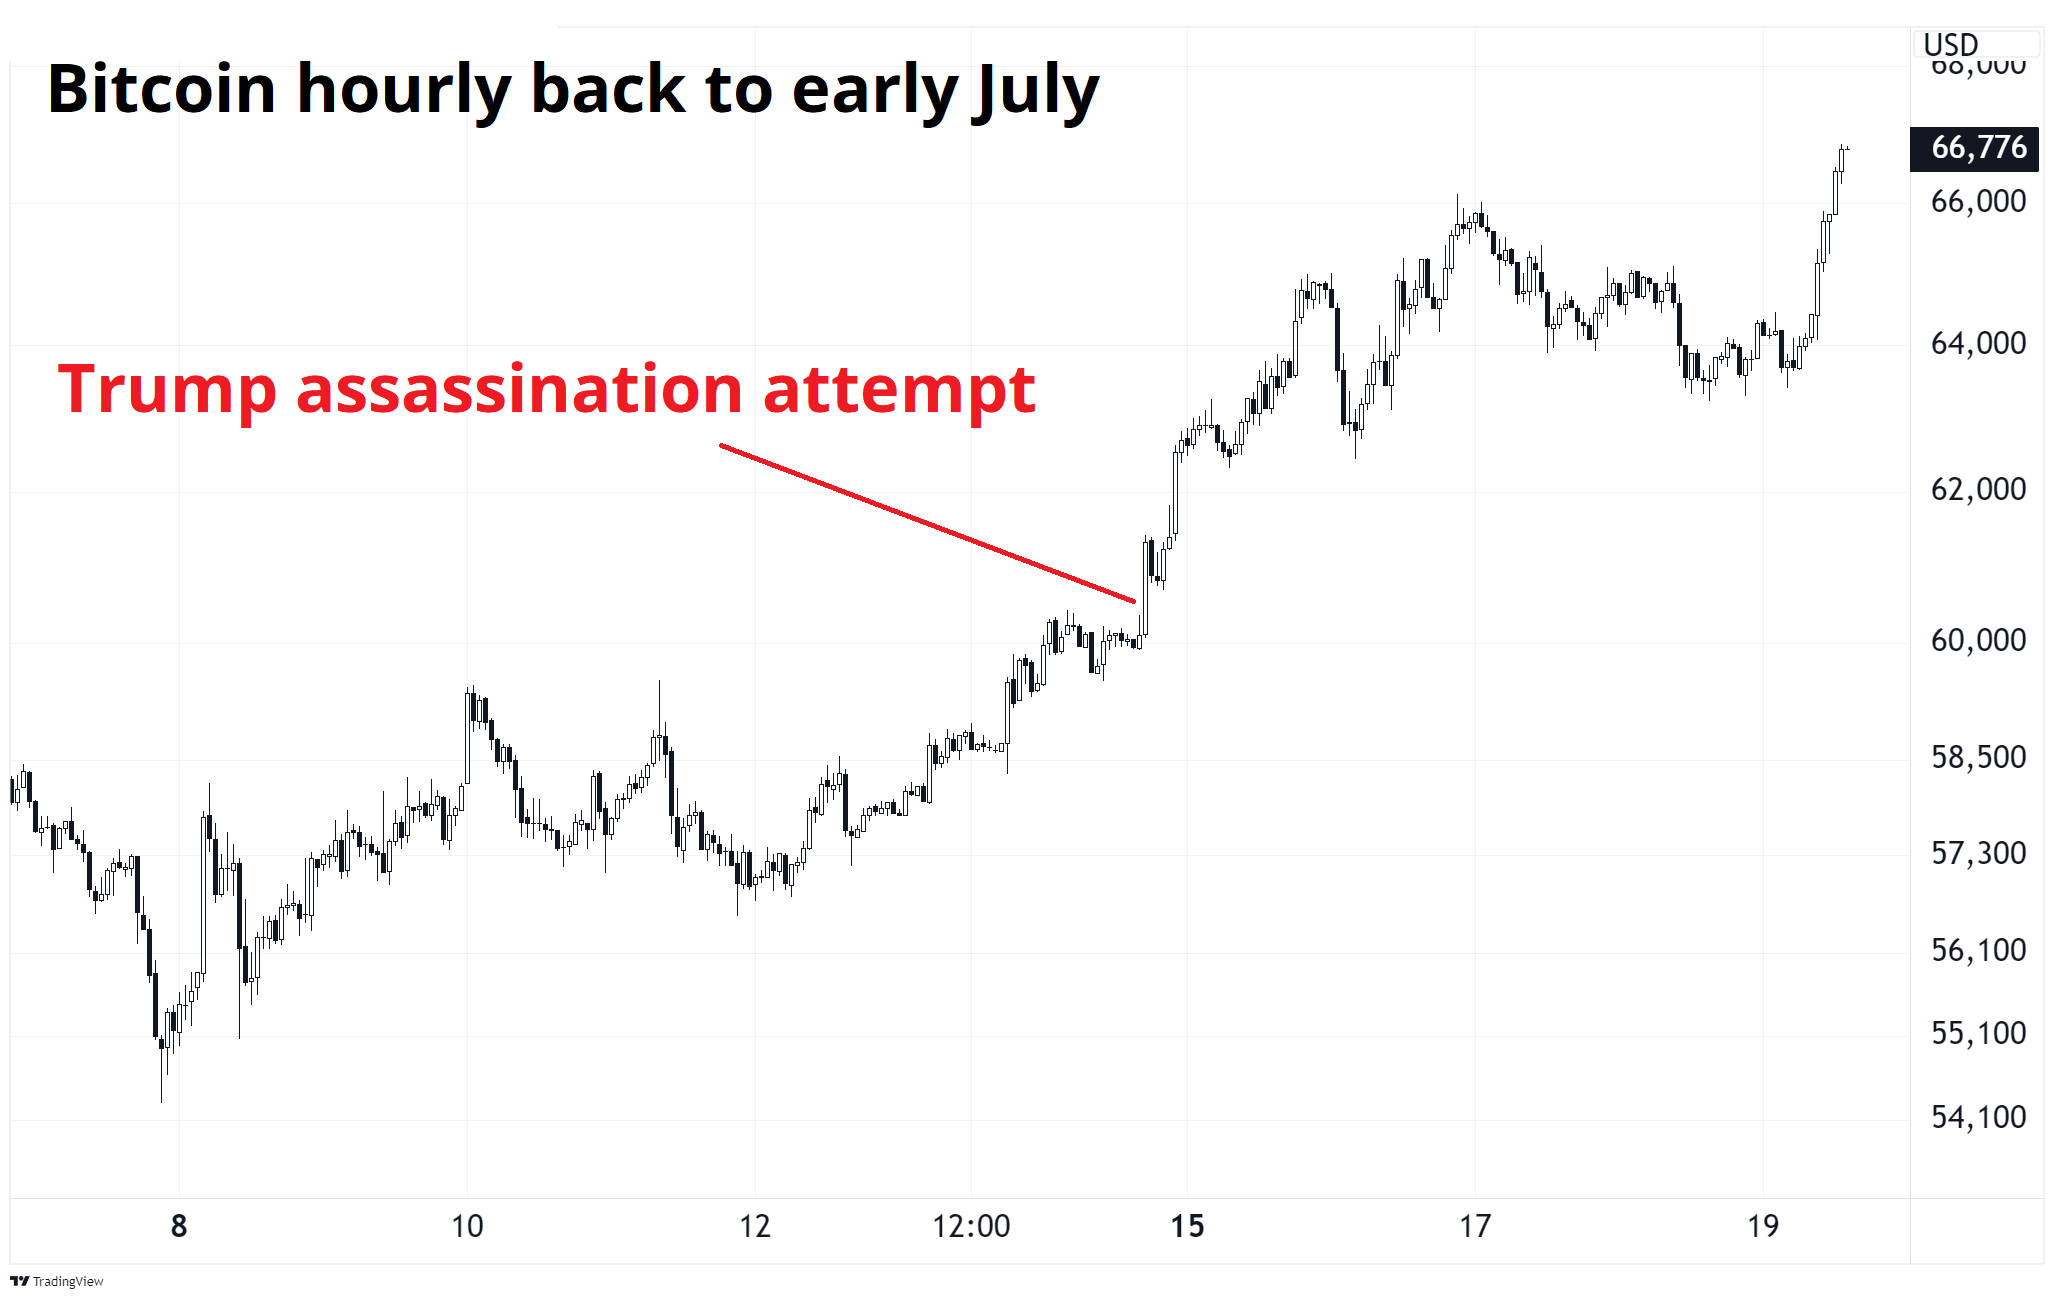
My levels in the 50k/53k zone never came close, but the deep discount of BTC relative to tech stocks probably played a role here as the Mt. Gox and German flows ended just as the buyers rushed in to position for a potentially friendly post-Red-Wave regulatory regime.
I don’t love to use positioning on its own as an indicator, but it can be a great timing and leverage tool in conjunction with a good thesis. The most powerful positioning indicator is when positioning in something gets to a mega, mega extreme. That is currently the case with corn futures, where the short is greater than 15% of open interest, a condition rarely seen since 2007. The chart I am about to present only goes back to 2016 because there were zero occurrences of this setup in the data from 2007 to 2016.
A problem intrinsic to searching for rare positioning events is that your sample size is going to be small, by definition. One offset to this problem is that I have found this sort of approach works well across many assets and so the sample isn’t as small as it looks. It works in other stuff, not just corn.
Anyway, here’s corn:
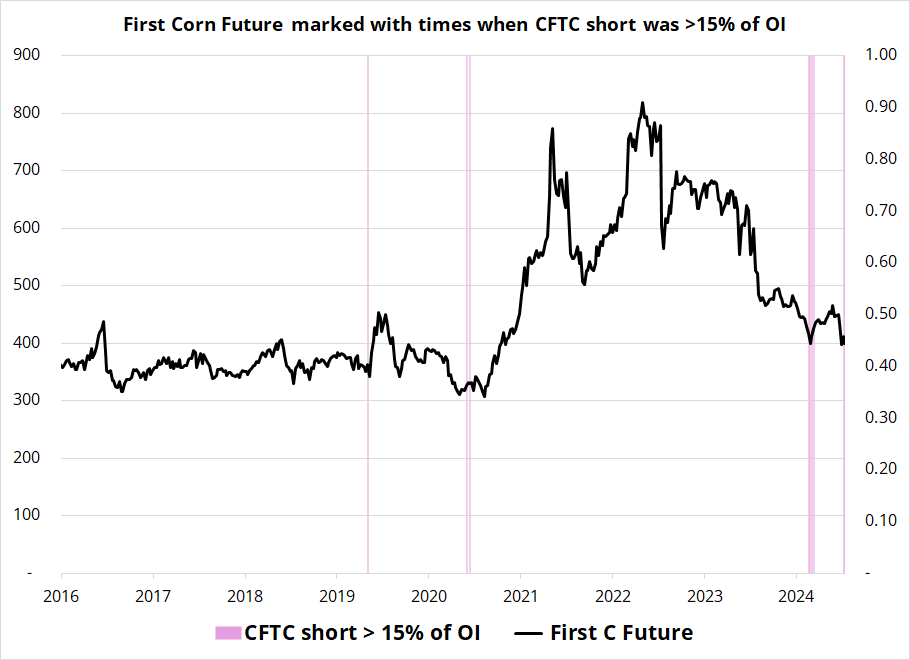
There are three non-overlapping signals if you use a 3-month holding period and the signal is 3-for-3 with average 3-month returns of 8.3% and a median return of 8.6%. We now have signal number four. There are no currencies correlated to corn. You just have to buy corn. Or not buy corn.
I mentioned last week how gold and the S&P 500 are both trading like risky assets in 2024 and this week was no exception as stocks, gold, and silver all got smoked.
This week’s Macro Trading Floor podcast is ready to go.
I think it’s a pretty interesting 37 minutes.
And! The first Ask Me Anything ran this week for Spectra School’s flagship course “Think Like a Market Professional”. In future, we will make the videos private for enrolled students only but in case you are curious, the first one is public. The questions are listed below the video, so you know what you’re getting into before you hit play.
https://www.spectramarkets.com/ask-me-anything15-july-2024/
OK! That was 12 minutes. Thanks for reading Friday Speedrun.
Get rich or have fun trying.
Smart, interesting, or funny
This thing snaps.
Get in there. US residents only.
Pueyo never disappoints.
Music
Heavy metal.
If this video doesn’t get you pumped, you were probably not alive in 1993.
I dare you to listen to this and not picture Jack Black!
Excellent stop / start style here and good storytelling and imagery!

Thanks for reading the Friday Speedrun! Sign up for free to receive our global macro wrap-up every week.
