The Fitch downgrade is irrelevant, but it does serve as a reminder of the current unhinged state of US fiscal policy. Also oil looks ready for a new, higher equilibrium.
The Baskin Robbins logo contains the number 31

The Fitch downgrade is irrelevant, but it does serve as a reminder of the current unhinged state of US fiscal policy. Also oil looks ready for a new, higher equilibrium.

The Baskin Robbins logo contains the number 31
August 2, 2023
While I believe the Fitch downgrade of the USA is as close to irrelevant as you can get as far as market news goes, it does serve as a reminder that US fiscal policy is completely unhinged. Back in ye olden days, the bygone era before 2017, there was a process where someone proposed some spending, and others replied with “How are we going to pay for it?” With Stephanie Kelton’s celebrity providing intellectual cover for MMT-style policies, the idea of offsetting spending with actual revenues is anachronistic to the point of sounding ridiculously naïve.
The obvious problem with trying to run an economy primarily with fiscal, not monetary policy, is that politicians are incentivized to spend, spend, spend, and any mention of austerity is likely to send them looking for another job on the day after election night. Donald Trump opened the door to procyclical fiscal stimulus at the peak of the pre-COVID cycle, and the post-COVID admin is upping the volume to 11/10.
This chart shows the relationship between the US Unemployment Rate and the budget deficit. ECO 001 teaches you that when times are tough, the government fills the gap with automatic stabilizers and discretionary stimulus. Current orthodoxy ignores the revenue side and spends at any arbitrary level determined via napkin doodles.
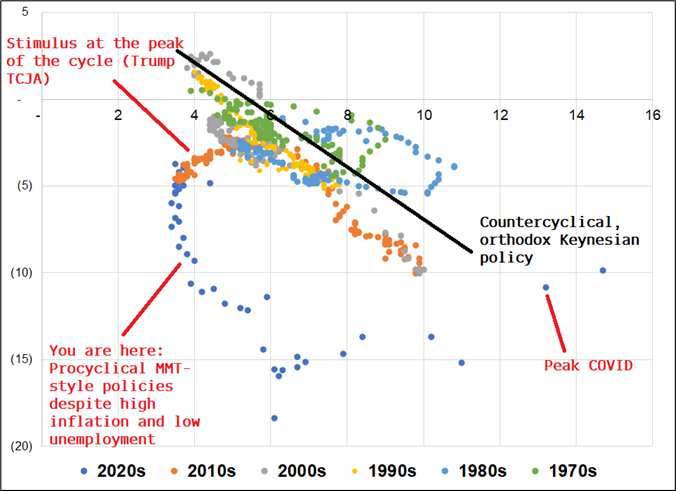
The figure looks complicated but it’s pretty simple:
Asking US politicians to reduce their spending is a bit like asking Blue Oyster Cult to use less cowbell. This does not matter during the juicy part of the cycle because US deficits can easily be offset by capital flows. On the other hand, when the US finally enters recession, there could be a huge price to pay as the USD will lose support and could fall much harder and faster than it fell in prior down cycles. For now, nobody cares.
In case you are not an oil expert, the API data yesterday was off the charts, showing the largest draw in the 40-year history of the series. Here is a chart of the data this year, and then back to 2018.
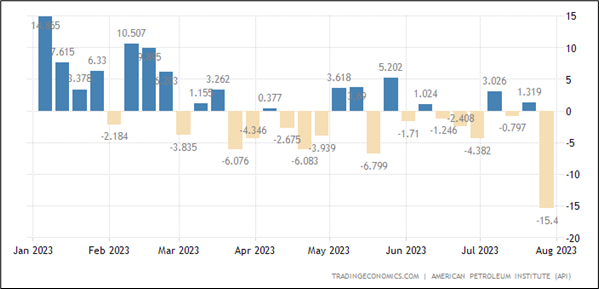
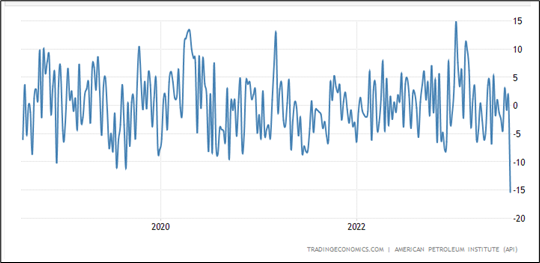
This data, if confirmed by the DoE today, buttresses the idea that the current rally in energy prices is more about organic levels of supply and demand in the real world. It’s not just financial speculators piling in as we saw all those other times.
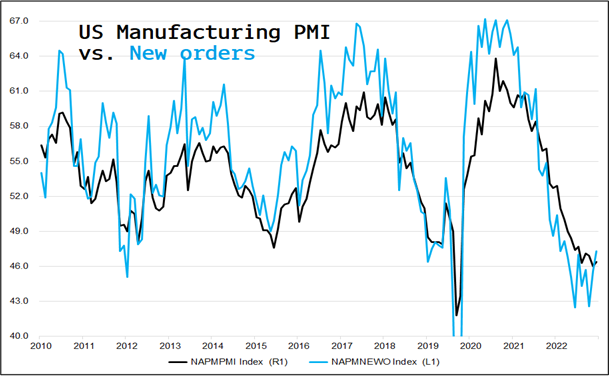
Meanwhile, yesterday’s data came out weaker than I expected, though the guts were decent enough to keep yields firm. Below is the chart of ISM Manufacturing vs. New Orders and the blue line is basing similar to the US S&P Manufacturing PMI. Certainly not an all clear, but it does look like manufacturing has at least stabilized in the USA.
Here’s where crude oil gets interesting:
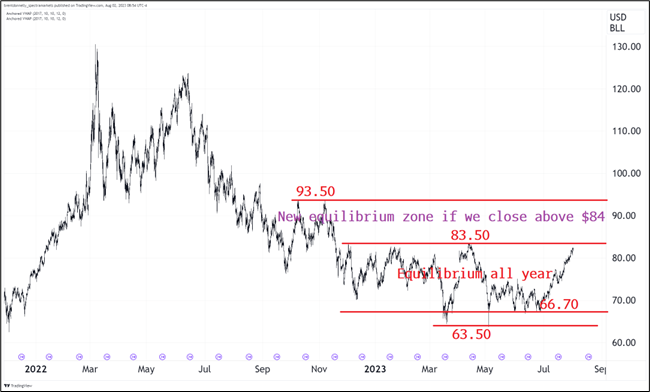
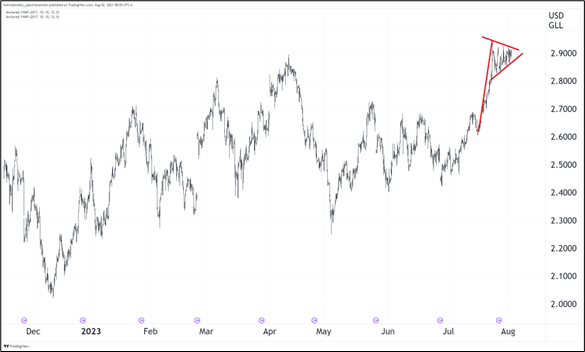
We have been 63.50/83.50 all year and thus if we can close above 84 (which I think we will soon), the new range becomes 83.50/93.50. And look at that textbook bull flag in RBOB! Inflation is not dead.
I am headed to Maine tomorrow for Camp Kotok. My report from last year is here. As I’m going to be away, and I have no strong view on payrolls, I think it’s appropriate to square up the EUR puts at some point today. I remain bullish USD overall on seasonality, positioning, and still-widening rate differentials, but I feel like the thesis has kinda played out in GBP and EUR at this point and thus it makes sense to get flat, especially as I have no strong lean on NFP. Finally, it’s healthy to be flat while out of town. Helps you come back fresh. The trade made a bit of money, but the move was too slow for it to deliver ginormous returns.
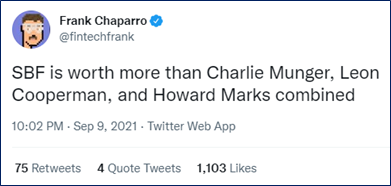
Fun flashback:
Have a rapidly-accelerating day. See you on August 8.

The BMW logo features the pattern of the Bavarian flag. At the time of BMW’s formation there was a popular movement for Bavarian independence from Germany. The company name – Bavarian Motor Works – similarly reflects the pro-independence mood.
—
The Tostitos logo features two friends dipping the product in salsa
