NFP tends to be weak in March after strong January-February. The Household Survey is a noisy series that has been bear food. But it’s getting hard to ignore.
What time is it on the moon?

NFP tends to be weak in March after strong January-February. The Household Survey is a noisy series that has been bear food. But it’s getting hard to ignore.

What time is it on the moon?
Short USDCAD @ 1.3575
Stop loss 1.3653
Long AUDUSD @ 0.6503
Stop loss 0.6434
Short USDNOK @ 10.8800
Stop loss 11.0410
Stop loss 0.8479
Take profit 0.8694
The household survey in the US is extremely volatile and is thus prone to send out more noise than signal. That is why traders watch NFP and markets react to NFP, not the Household Survey. Late 2022 is a good example of this as the household survey printed negative in April, June, July, and November 2022 and then mean reverted as it often does, ripping stronger again afterwards to make up for lost time. Meanwhile, NFP just chugged along steadily the whole time and showed its reliability and signal value. That period was a perfect example of how the volatility of the household survey makes it close to (but perhaps not completely?) useless.
Recall that throughout 2022, weakness in the Household Survey was held up as a sure sign of coming recession. See here, here, and here, for example. But it was all just dark noise.
This time is different … fr fr
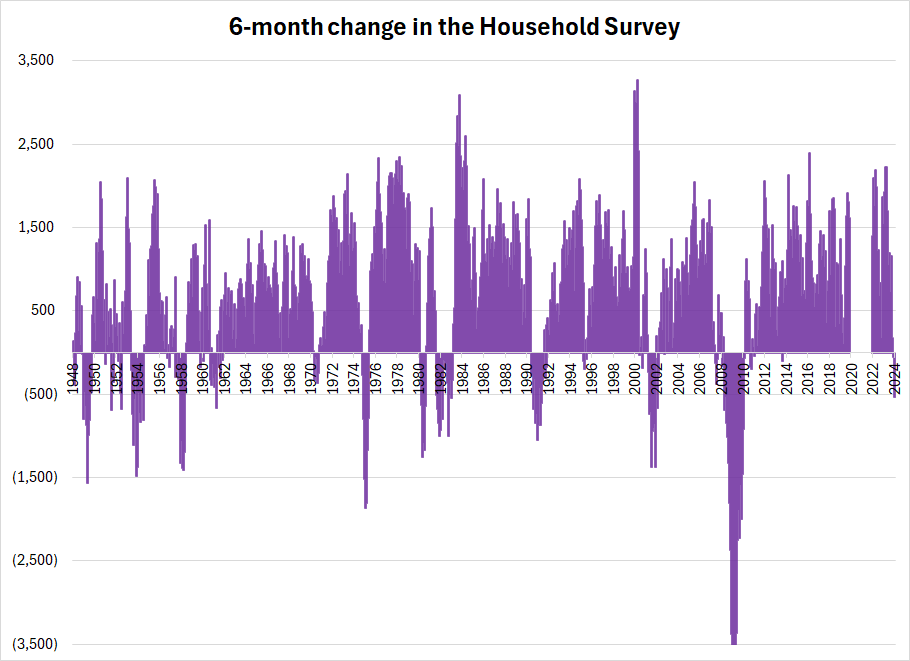
The thing about that 2022 period is that if you take the 6-month average (which is an appropriate way to smooth an extremely erratic series like the household survey), it never went negative in 2022. Now, the weakness in the household survey appears more persistent and it’s getting harder to write it off as purely noise. As you can see in this chart, we’re at -532k now, a figure generally only seen during recessions.
I was curious whether or not large negative 6-month changes in the Household Survey were predictive of weak NFP. I looked at NFP (actual vs. expected) in periods where the household survey 6-month change was -200k or worse and got this odd-looking chart.
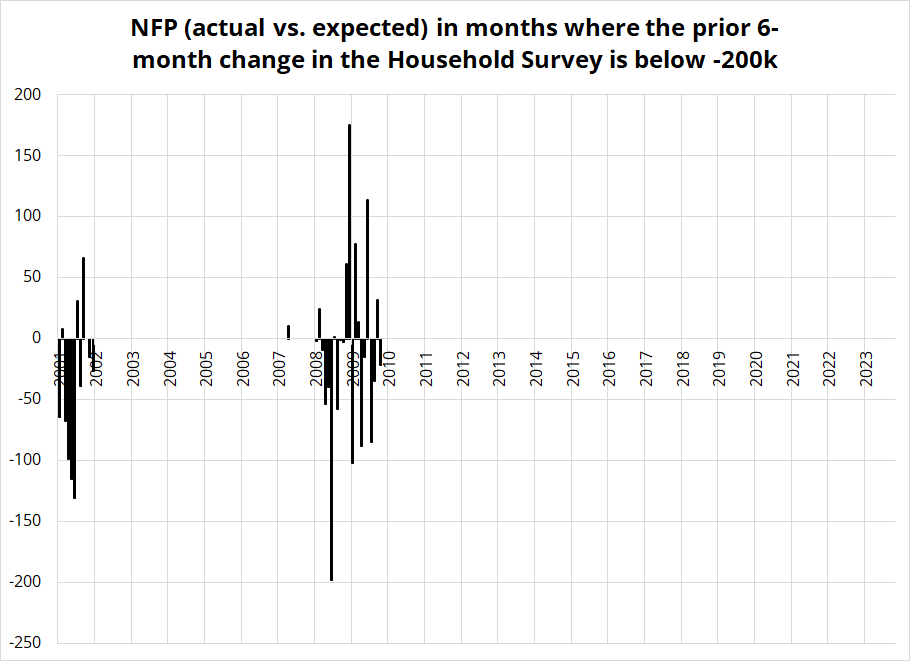
The filter for the chart is 6-month change in household survey is -200k or lower and we are currently at -532k. So, the condition is met this month.
The chart shows that going into recession, economists are too optimistic on jobs growth and coming out of recession, they are too pessimistic. We probably already knew this! The real question is whether the negative 532k job loss in the household survey is a recession indicator, or is it simply another weird aberration of the post-hypercycle world? Is it related to the spike in US immigration? This paper makes that case somewhat convincingly…
https://www.brookings.edu/wp-content/uploads/2024/03/20240307_ImmigrationEmployment_Paper.pdf
Anyway, another thing to consider going into the Friday data is that since 2018, there has been a general pattern of strong data in January and February, followed by weaker data in March. The simplest way to see this is to just add the rolling total of NFP beat or miss (actual vs. expected) for each month. That yields this chart.
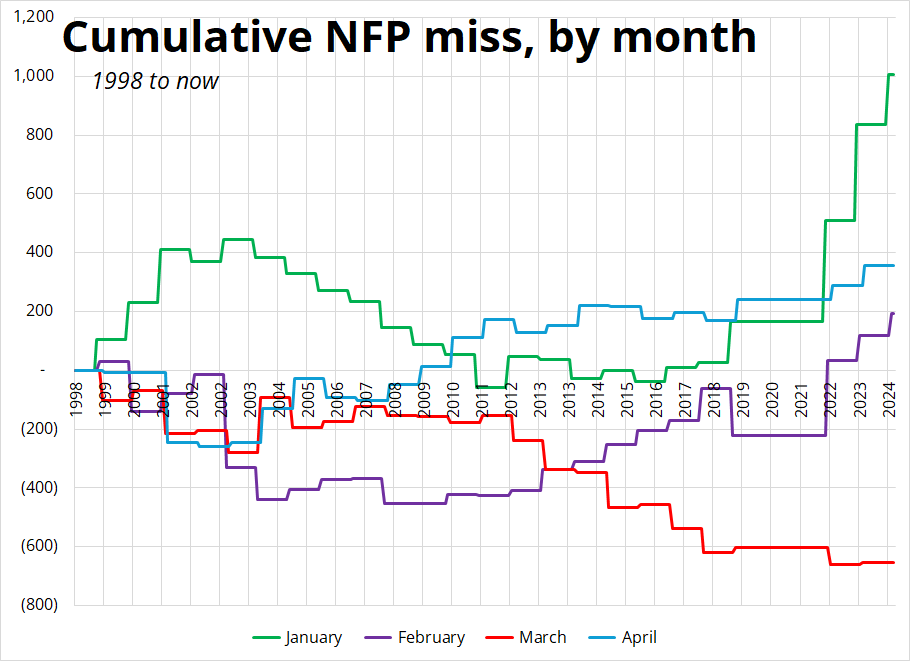
You can see that March just tends to be soggy throughout, while January and February strength look to be more of a post-COVID artifact as seasonal adjustment of pre/post-2020 Q1 data has been a big issue.
Overall, despite the strength in ADP today, all this makes me lean towards a weak NFP on Friday. I would put my ex-ante odds of a beat vs. a miss on the headline figure at 38/62 given the weakness in the household survey coupled with the bias towards March weakness. Pardon the false precision, but 40/60 felt timid while 35/65 felt too strong.
One: A pedantic note on entry points for Current Views. I start typing this thing around 7 a.m. and send it around 9:30 a.m., generally. I try to update my entry points on the trade ideas as I’m about to send out am/FX, but sometimes markets are moving! Yesterday, for example, I had 1.3565 as my entry for USDCAD but by the time I hit send, USDCAD was 1.3575/76. So, I updated my entry points today to reflect where spot markets were trading when I hit send. I have always done this, forever, but figured I’d mention it just in case you are a new subscriber wondering how that works. Thanks!
Two: I showed a chart of DBA yesterday, but it’s worth noting that a client then pointed out to me that 25% of the DBA portfolio is cocoa. So maybe not a useful chart. Still, commodities are rallying much more broadly than just cocoa, so my general point on commods still holds.
Three: 152 USDJPY getting close. Keep an eye out for rate checks and general nervousness.
Four: Have a timely, rock-solid day.


A sort of almost unbelievably large move in Brazil. Plus: Short CADJPY.