And some rebus-like trivia kinda thing.


Name the song

And some rebus-like trivia kinda thing.

Name the song
Long USDCAD @ 1.3230
Stop loss 1.3088
July 13, 2023
There is a broad feeling of malaise in the FX market as few caught this USD down move and plenty (like me) tried to fade it. The leadership provided by Japan has been interesting as the Nikkei turned lower first, then USDJPY, then US yields. And while a small portion of the US yield move can be blamed on CPI, the big turn off 4.09% was already in force before yesterday’s release.
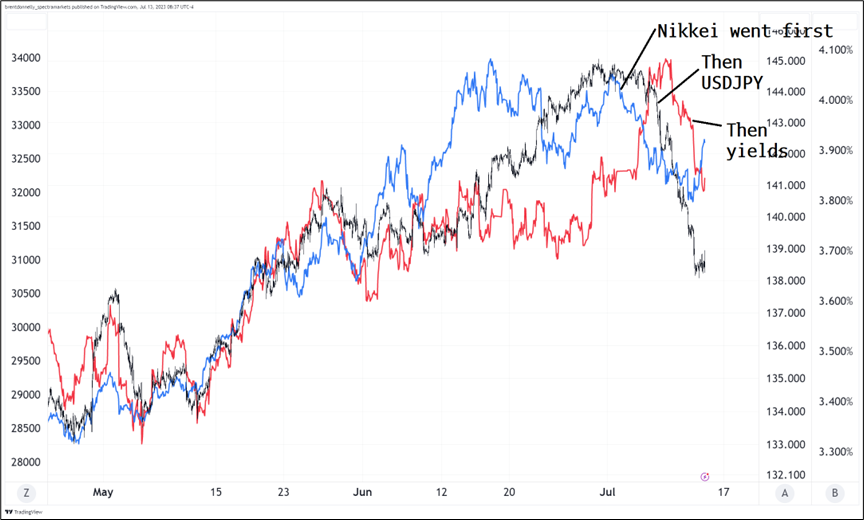
This is interesting because you can see that the Nikkei has gone back up significantly, yields are holding the late June support level at 3.80% and USDJPY is in a major support zone as you can see here:
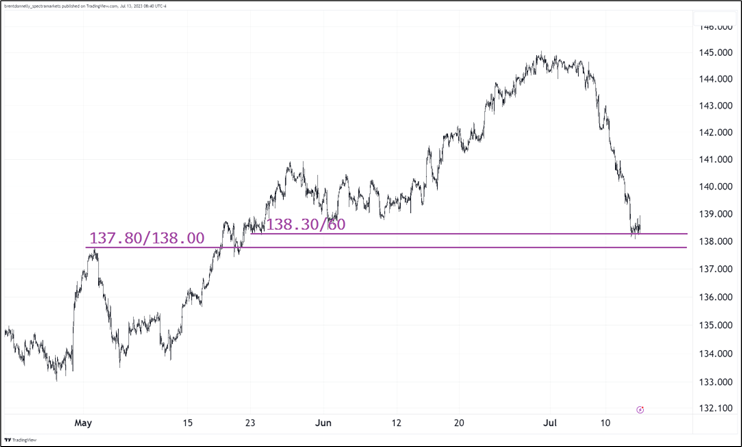
So, while GBP and EUR continue their Mach 4 ascent towards Mars, USDJPY has stabilized after completing the 138.50/145.00/138.50 round trip that began in late May or early June. As yields and Nikkei have stabilized, I believe (as mentioned yesterday) that 138 is the handle to take profits, not add. My guess is that a change in YCC at the July meeting is about 80% priced in at this point.
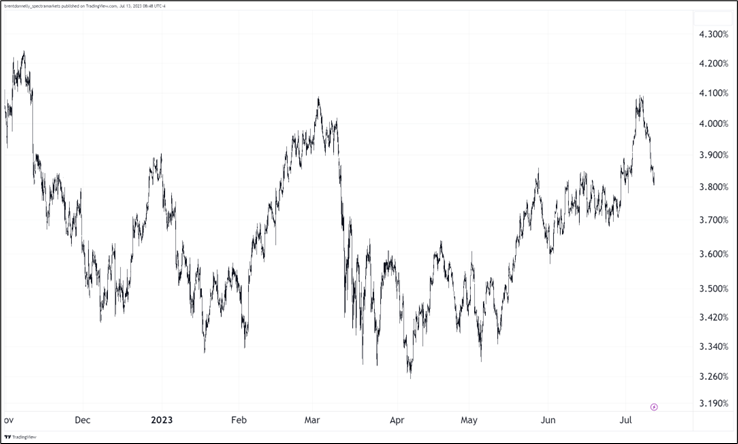
And just to keep this on your radar. What an incredible double top in US 10-year yields.
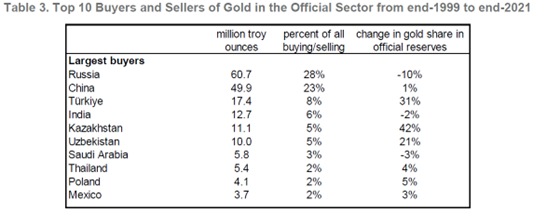
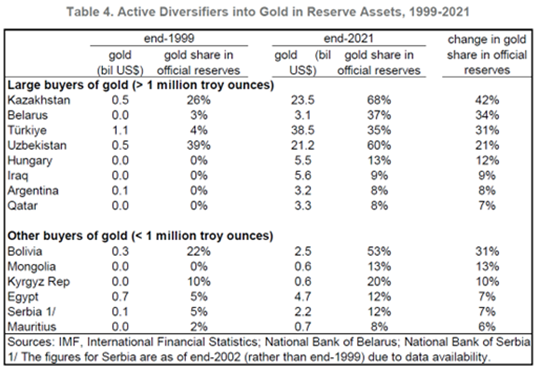
One of the big arguments in favor of gold is that central banks are buying it like crazy. Part of this is an EM outperformance thing and part of it is some countries want to get away from dependence on G10 FX reserves (specifically the euro and the dollar) because a bipolar world means reserves held in enemy currencies on enemy payment platforms and in enemy banking systems are at risk. Iran experienced this in the 2010s and Russia learned this lesson the hard way after they went into Ukraine.
Here are the countries buying gold. The table is from this excellent paper from the IMF: Gold, Barbarous Relic No More.
If you’re short on time, here is the abstract of that paper:
After moving slowly downward for the better part of four decades, central bank gold holdings have risen since the Global Financial Crisis. We identify 14 “active diversifiers,” defined as countries that purchased gold and raised its share in total reserves by at least 5 percentage points over the last two decades. In contrast to the diversification of foreign currency reserves, which has been undertaken by advanced and developing country central banks alike, active diversifiers into gold are exclusively emerging markets. We document two sets of factors contributing to this trend. First, gold appeals to central bank reserve managers as a safe haven in periods of economic, financial and geopolitical volatility, when the return on alternative financial assets is low. Second, the imposition of financial sanctions by the United States, United Kingdom, European Union and Japan, the main reserve-issuing economies, is associated with an increase in the share of central bank reserves held in the form of gold.
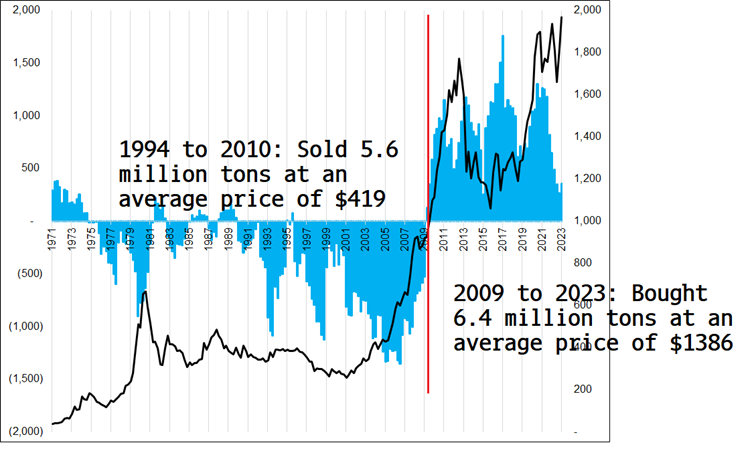
An excellent recap of the bullish gold because central banks are buying as the world turns more bipolar is presented by Zoltan Poszar in his recent Odd Lots interview. The logic is compelling, but I am wondering if there is an element of extrapolation here as the thesis relies on a continuation of a trend that started in 2009 and has thus been going on for 14 years.
In contrast, you might also argue that Russia is probably fully de-euroized and they were already dedollarized by 2018 or so. While central bank buying power is an incredible, persistent flow that can go on for years, how many more rogue nations are left that are going to exit the liberal “Rules Based Order” now that China and Russia are hedged for the bipolar world? Here are the countries actively diversifying into gold since 1999.
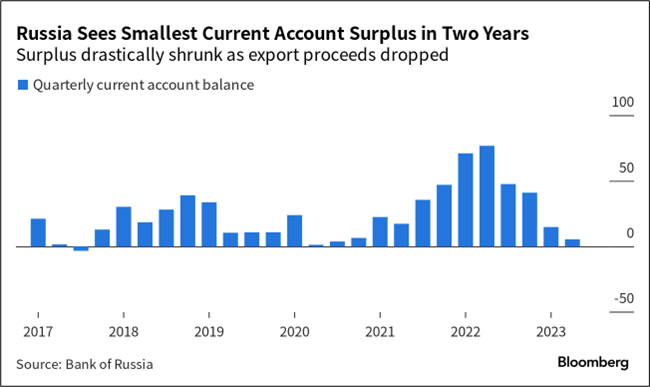
In other words, who’s the next Russia now that they have deG10-ized and their current account is back to flat? Again, acknowledging that central bank flow is huge and meaningful, in the bigger picture my observation is that central banks herd into popular themes the same way speculators do. Their track record in gold and USD diversification is horrendous.
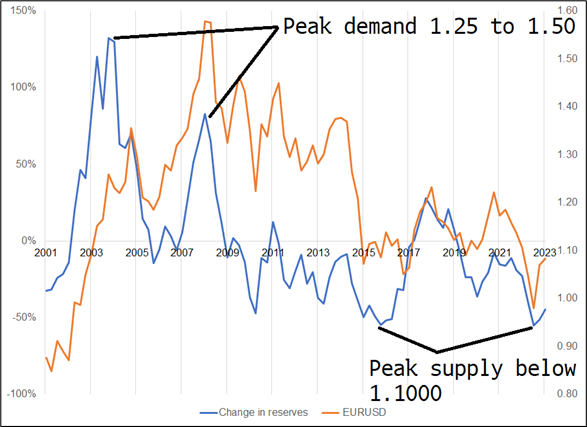
This is similar to how central banks bought euros above 1.30 (and got ravenous when EURUSD broke above 1.50)… And sold below 1.10. Here is a chart of changes in EUR reserves vs. EURUSD.
Central banks have huge, but not unlimited ability to drive markets via non-price-sensitive buying. In the end, central banks are run by humans and humans are prone to herding. The idea that a bipolar world will lead central banks to hoard gold makes a ton of sense and it could easily be correct for years to come. On the other hand, the thesis relies on considerable extrapolation of a trend that has been in force for 14 years.
The takeaway if you are not just permalong gold as an insurance trade, is to closely watch the central bank buying data and try to identify if and when they run out of bullets or feel like they have de-euro and dedollarized enough to feel safe from the threat of currency reserve and payment system weaponization. Food for thought, anyway.
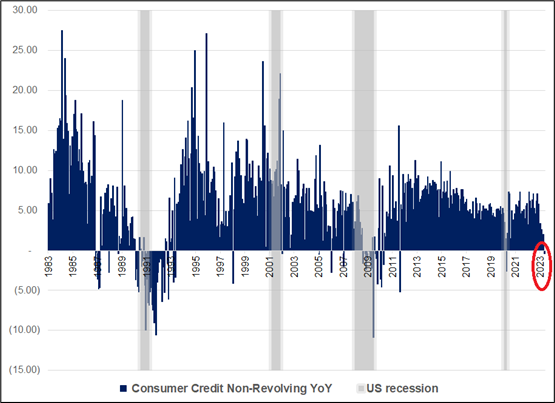
In case you missed it, a friend of mine mentioned this to me and it’s an intriguing chart as many (including me) have become desensitized to bearish forward-looking US economic indicators given the litany of false positives on recession over the past seven months. Maybe this was just 2006/2007 all over again? Lags are nasty.
Have a never punt on fourth down kinda day.
Can you name the songs? Answers tomorrow.