Every now and then, I like to check in on bitcoin to make sure that what I think I know about it is actually true. That’s what today’s piece is about.
There is a full-size replica of the
Parthenon in Nashville. Neat.

Every now and then, I like to check in on bitcoin to make sure that what I think I know about it is actually true. That’s what today’s piece is about.

There is a full-size replica of the
Parthenon in Nashville. Neat.
Short EURGBP @ 0.8634
Stop loss 0.8756
Take profit 0.8444
May 31, 2023
The evolution of bitcoin over time has been something to behold. What started out as a privacy-driven peer-to-peer payment system and middle finger to bank bailouts morphed into many things including a gambling token, a flow product, a hedge against loose monetary policy, and a proxy for gold, the NASDAQ or the US dollar.
Bitcoin’s ability to shapeshift and its origin as OG first mover in crypto have given it incredible resilience through a few hype cycles now. Bitcoin also has a clear use case (digital gold, finite money in an infinite-money MMT world) and special privilege from regulators who unambiguously view it as NOT a security. The rest of the 20,000+ crypto tokens out there have infinite competition and tremendous regulatory uncertainty in the US as any or none or all of them could be securities.
Institutional adoption was supposed to be the thing that took bitcoin to $100,000 or $1,000,000 or whatever, but instead of delivering BTC to the moon, institutional adoption set the high-water mark for the price of every cryptocurrency. Wall Street herded in along with retail in 2021 and 2022 and now we are left to figure out what’s next.
If you’re holding an asset for whatever reason, whether it’s capital appreciation, yield, insurance, or hedging, you want to know what the thing is and how it reacts in different regimes. I view bitcoin as a 4-way hybrid: risky high-tech asset, hedge for loose monetary policy, anti-USD proxy, and digital gold.
As you know if you have read my stuff for a while, I like simple models. I don’t like brute force or optimization as they tend to lead to overfitting that performs poorly out of sample. And I tend to quickly find that I don’t know what I’m doing. Instead, I prefer to form a hypothesis, test it, and stop there. Based on my description of bitcoin above, a reasonable model might be 4 parts: NASDAQ, US 2-year yield, USD, and gold.
Any model like this is likely to fit pretty well after COVID and less well before because institutional adoption, the rise of Big Crypto, and the emergence of bitcoin as another Wall Street plaything all happened after the historic events of 2020/2021. Here’s the result if you use 2020 to 2022 to build the model then allow 2023 to run out of sample.
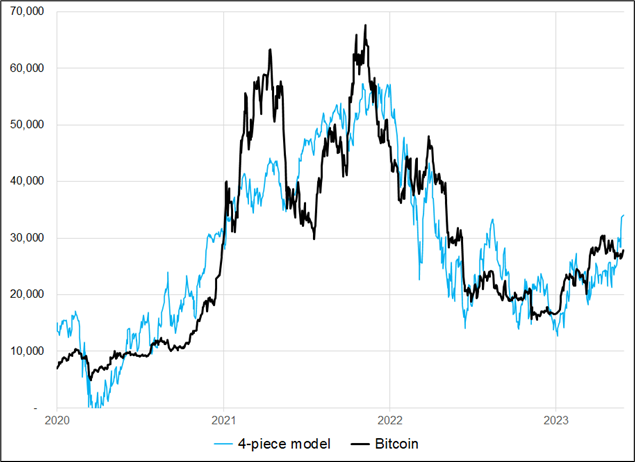
The thing with this model, though, is that if you run each of these variables against bitcoin separately, the r-squareds are 73%, 6%, 4%, and 13%. NASDAQ dominates. If you use NASDAQ to create your model, the output looks like this:
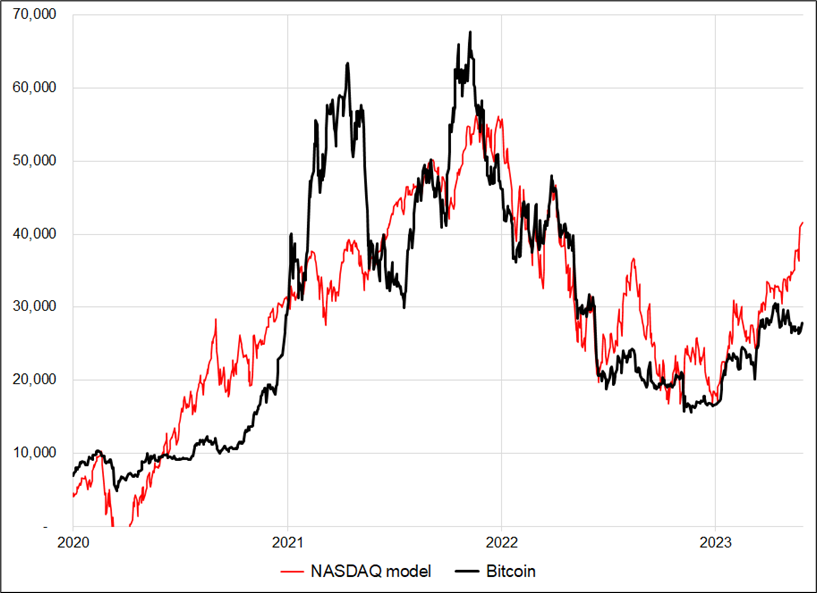
I think the first model is better because the other inputs dampen the beta of the sharp NASDAQ moves and probably offer a bit of information when NASDAQ isn’t moving. There is no call to action here, this is mostly an effort to explain, not predict bitcoin. As David Deutsch often emphasizes: there is value to understanding the world and attempting to find explanations for phenomena—everything does not always have to be about prediction¹. Anyhoo, here are my takeaways / observations.
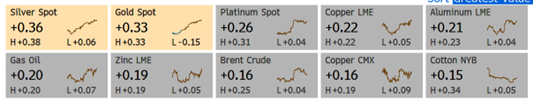
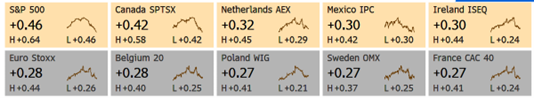
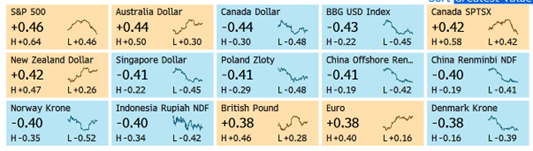
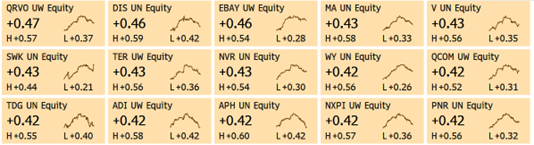
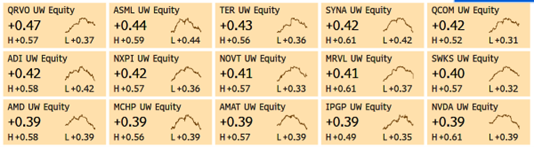
While I don’t like using brute force for models, I do like using it to satisfy my curiosity. So on the next page you can see the 200-day bitcoin correlations against a wide variety of instruments, for your scanning pleasure. These are pulled from the CFND function in Bloomberg, which ranks them by highest to lowest corr.
—
¹ David Deutsch, from The Fabric of Reality… “Many intrinsically unpredictable things can be explained and understood. For example, you cannot predict what numbers will come up on a fair roulette wheel. But if you understand what it is in the wheel’s design and operation that makes it fair, then you can explain why predicting the numbers is impossible. And again, merely knowing that the wheel is fair is not the same as understanding what makes it fair.”
My call on USDCNH was bad. Impressive how it refuses to pull back. I plan to send a dispatch from Nashville either tomorrow or Friday. Have a stoic day.
There is a full-size replica of the Parthenon in Nashville, Tennessee!
https://www.artsy.net/article/artsy-editorial-full-scale-replica-parthenon-nashville-tennessee
