

One of my favorite kids’ books is “Don’t Let the Pigeon Drive the Bus!”
Listen to this as a podcast: on the web … on Spotify … on Apple
Market update
Last week, I cut the short BTC around 38000 and said I thought we would get a small rally towards 41000 after the Fed. I suggested it was best to stay away from that rally as it would be short-lived and not worth the effort as we would soon return to risk aversion, even if the Fed meeting yielded a dovish result.
I don’t see much point in engaging here at 31000. If you are looking for the dream buy-the-dip levels, I still believe the lines laid out in MTC #11 make sense. You can read that article for full explanations, but here are the buy triggers I outlined in that piece:
- Solana $58/$66.
- False break of 28000 in BTC. That is, a break below 28000 followed by a rally through 30000 is bullish.
- BTC at 22000.
- Fed turns dovish (not happening for a while as they are on autopilot for several meetings as they try to catch up to market pricing).
There are so many headwinds right now with the LUNA FUD, the MSTR convexity risk, and the start of Fed QT in June. Stay patient and leave bids so you can take advantage of the liquidity black holes that inevitably appear from time to time.
Who’s driving the bus?
I was about 10 years into my trading career in 2004 when I read a little-known book called: “Intermarket Technical Analysis” by John Murphy. The author is best known for his book on technical analysis which many view as the bible of the genre. I don’t recommend Murphy’s Intermarket book as it’s kind of old and full of specific intermarket relationships that are not necessarily persistent or robust. That said, the book completely changed how I look at markets.
Here’s the description from the back of the book:
Trying to trade stock, bond, commodity and currency markets without intermarket awareness is like trying to drive a car without looking out the side and rear windows–very dangerous. In this guide to intermarket analysis, the author uses years of experience in technical analysis plus extensive charts to clearly demonstrate the interrelationships that exist among the various market sectors and their importance. You’ll learn how to use activity in surrounding markets in the same way that most people employ traditional technical indicators for directional clues. Shows the analyst how to focus outward, rather than inward, to provide a more rational understanding of technical forces at work in the marketplace.
The book opened my eyes to the extreme complexity of markets as I stopped looking at each product or market individually and realized that all markets are intertwined and interconnected in various simple and obvious, and also complex and opaque ways.
The next ten years of my trading career, I sought to become an expert on cross-market, correlation, or lead/lag trading. That is a style of trading where you try to use movements in many markets to predict movements in your market of focus. Since I am mostly a fiat currency trader, this means looking at relationships such as crude oil vs. CAD, interest rate differentials vs. currency pairs, and so on.
Here, as one example, is a common relationship in FX markets, USDJPY (black bars) vs. the US 10-year yield (blue line).
USDJPY vs. US 10-year yield (hourly since July 2021)
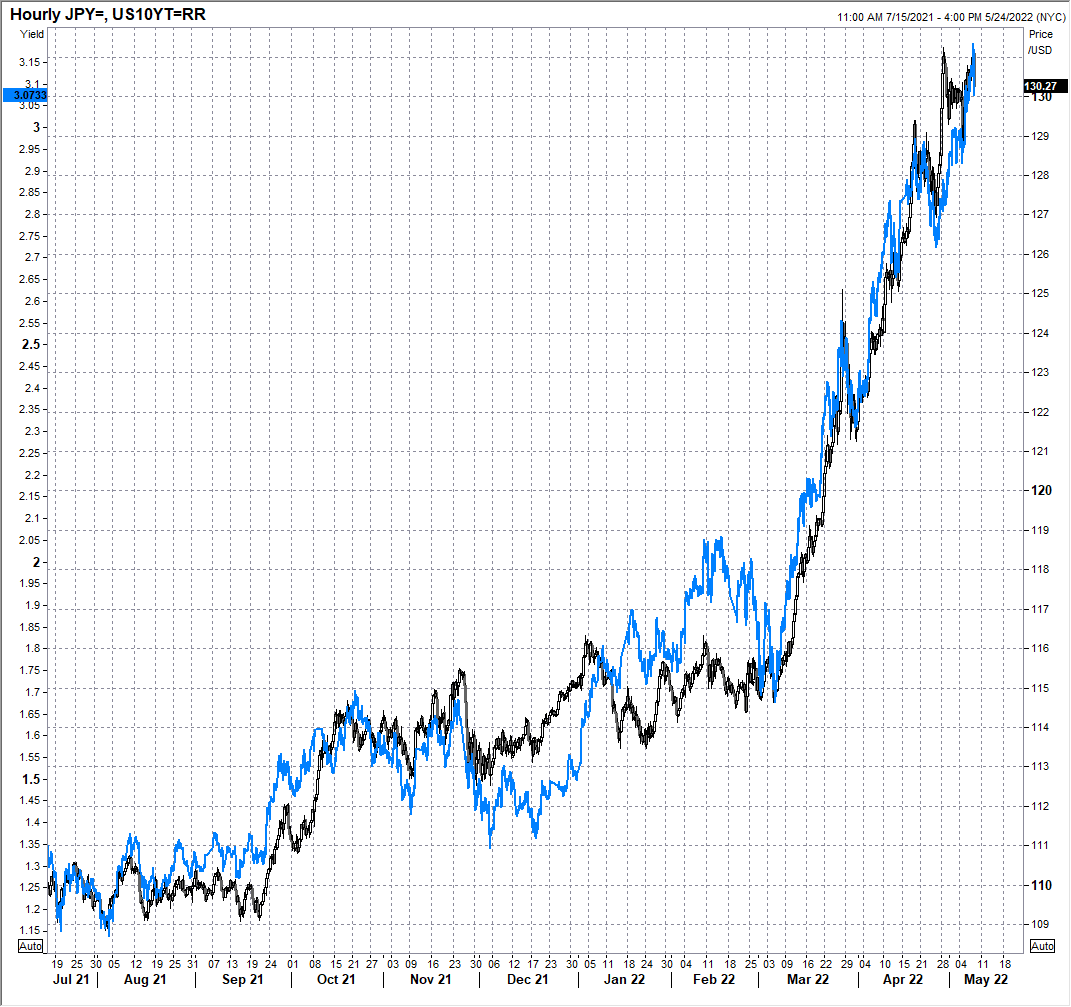
This is not a spurious correlation. It has been mostly stable since the mid-2000s and is the direct result of flows. When US rates go up, Japanese institutions move out of lower-yielding assets and into USD. When rates fall, they repatriate and exit the USD. It’s not quite, but almost that simple.
While correlations can be 1:1 driven by flows like this, very often the correlation between two markets is a more complex process, driven by a third variable. That is, one market is not causing the other one to move, the two markets are both being driven by a third factor. For example, you will usually see a strong correlation between Exxon stock and Chevron stock, but there is no causation running between those stocks. The third variable is the price of oil. When oil goes up, both stocks rally.
Less obvious third variables can drive other asset pairs. For example, Fed policy might drive the price of two risky assets as overall risk appetite and the price of risky assets is driven, to some extent, by Fed policy. Since I started in 1995, global liquidity is the most important variable driving the price of all risky assets. And Fed liquidity is usually the most important driver of global liquidity.
Observing the correlation of two risky assets and watching them go up and down together as Fed expectations change is usually uncontroversial. If I show a chart of the S&P 500 and copper moving in cointegrated fashion, and talk about how they are going up and down in tandem in line with expectations about US rates and Fed policy, nobody accuses me of hating copper or being biased against the S&P 500.
In contrast, when I post a chart like this…
Bitcoin vs. NASDAQ futures, past two months
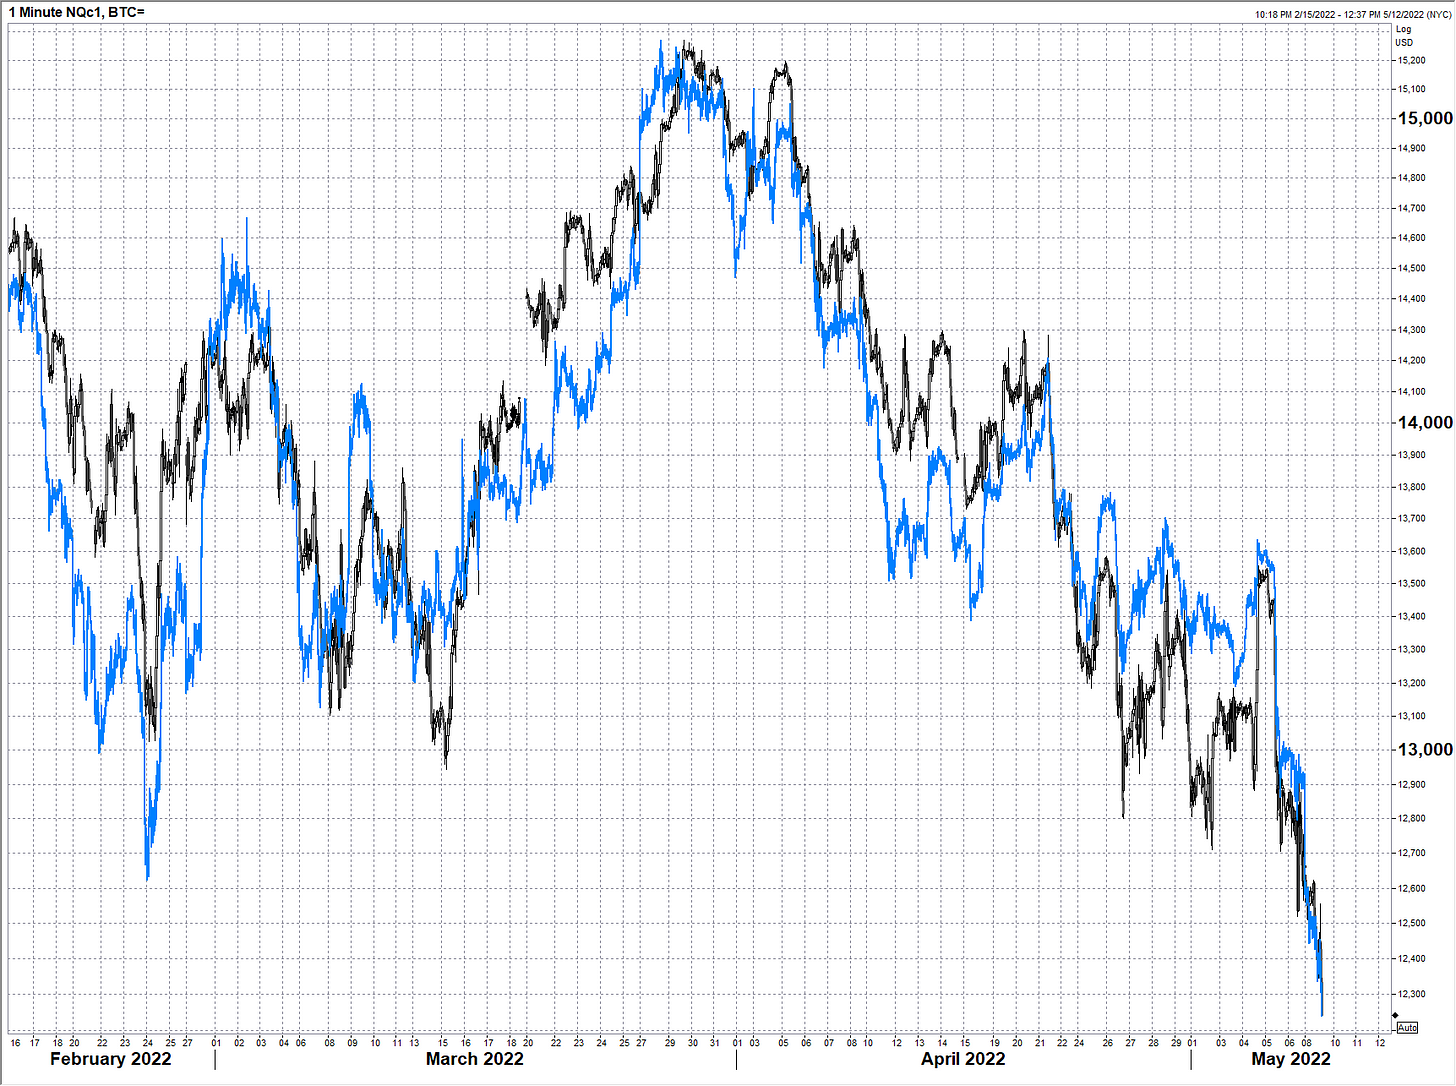
…some view it as an affront to bitcoin that clearly reveals my hatred and confirms my bias against crypto. Nope. I am agnostic on bitcoin, up or down. I just want to make money. The idea is simply to understand what is driving an asset or market and use this information to trade more successfully. A chart like this does not state or imply:
- Bitcoin will forever be correlated with NASDAQ
- Bitcoin will forever trade like a risky asset
All it shows is that bitcoin is currently trading like a risky asset and has been for a while. This is useful information if you’re trading crypto. While most people in crypto now have a pretty good understanding that BTC trades like a risky asset, the real key is what happens in the future.
So today, I want to dig into the drivers of crypto so that we have a starting point for future observations. The holy grail for crypto bulls is the day crypto decouples from a falling stock market. On the other hand, the worst-case scenario in the short run is that the NASDAQ finds a base, and crypto keeps going lower. There is information in the correlations between markets and there is information when those correlations change.
If your prior was that BTC is a safe haven, you should have updated your prior ages ago.
Let’s take a look at the macro drivers of crypto in the past, the drivers now, and some possibilities for drivers in the future. But first, let me give you a few short words of general need-to-know info about cross-market correlation.
Need to know about cross-market correlation
Let me just do bullets to keep it quick:
- Most financial market correlations are not causal. The markets are going up and down together in non-random, and non-spurious ways, but they are not driving each other, they are being driven by other hidden factors like liquidity, the economy, global risk appetite, and so on.
- Correlations are not static. Sometimes gold trades like a risky asset, sometimes it trades off real interest rates, sometimes it reacts to geopolitics, and much of the time nobody can explain what it’s going to do until after it moves. Stocks and bonds were inversely correlated for many decades and then became mostly positively correlated after QE. Oil and S&P futures were positively correlated through most of my trading career through this process: Strong global demand = good economy = buy oil = buy stocks. Now the process is: Supply chain problems and war = inflation scare = buy oil = sell stocks.
- You can make money trading lead/lag but it’s an art, not a science. Lead/lag traders watch many markets and look for direction and momentum in one market to signal potential movements in other markets. If BTC rallies 1k out of nowhere and ETH hasn’t moved, most people would rather be long ETH at that moment than short. This makes sense! In fiat, when US rates go up, I know the short-term distribution of USD returns is skewed to the topside. Higher rates make a higher USD more likely, all other things being equal. But it does not mean the USD is definitely going up. Correlation is just one input and many other factors should be considered.
Macro crypto drivers
The chart I showed of the NASDAQ vs. bitcoin shows that the market currently views both of those markets as long duration, interest-rate-sensitive risky assets. If the Fed is pouring gasoline on markets in the form of quantitative easing, that’s bullish. If they are hosing down the fire as they transition from arsonist to firefighter, that’s bearish. This is clear when we look at the correlations of bitcoin to NASDAQ and SPX.
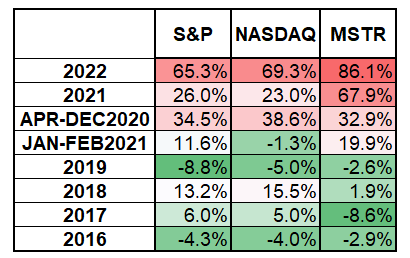
You can also see from the table that BTC was uncorrelated to risky assets before COVID. The small exception to this was 2018, as the Fed started QT and all risky assets dirtnapped, including crypto. Current sky-high correlation shows how Fed and fiscal policy have completely crowded out all other types of analysis. The Fed is the only game in town since March 2020. Much as there are many variables in play when you sail a boat… If there’s a hurricane, nothing else matters.
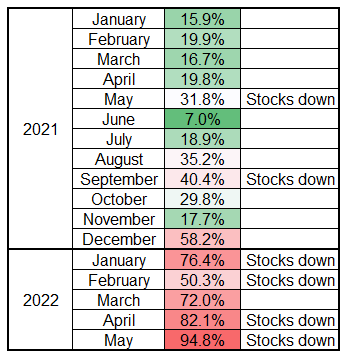
If we drill into the monthly correlation figures, we can see that the correlation rose steadily throughout 2021 and really started to go bananas when US stocks sold off. This table shows the correlation for each month, along with months where SPX went down noted in the third column. When liquidity and risk aversion hit, babies get thrown out along with the bathwater.
Another way of looking at the relationship between BTC and the NASDAQ is to ask this question: “If I told you what NASDAQ did today, how likely is it you could tell me what bitcoin did?” Here is the data over the past 12 months:
If NASDAQ down 2% or more in a day, BTC was down 93% of the time.
If NASDAQ down 0% to 2%, BTC down 60% of the time.
If NASDAQ up 0% to 2%, BTC up 58% of the time.
If NASDAQ up 2% or more, BTC up 95% of the time.
This type of output is common when we study correlations between markets. When there are huge moves, correlation is super reliable and when things are less volatile, correlation drops. In other words, high volatility tends to produce high correlation.
So the takeaways so far are:
- Crypto correlation to macro has never been higher than it is right now.
- Fed rate hikes and QT lead to lower asset prices and higher crypto correlation to NASDAQ.
- Watch for falling crypto vs. NASDAQ correlation as a bullish sign for all risky assets, including crypto.
What about the next fractal?
So far, I’ve discussed the Fed and its impact on various asset classes, especially crypto and NASDAQ. I have mostly been using “crypto” and “BTC” interchangeably because whenever I look at a string of crypto prices, they all tend to move together. Here are the 24-hour and 7-day % returns for the top 10 cryptocurrencies as I write this.
Top 10 cryptocurrencies: Performance in past 24 hours and past 7 days
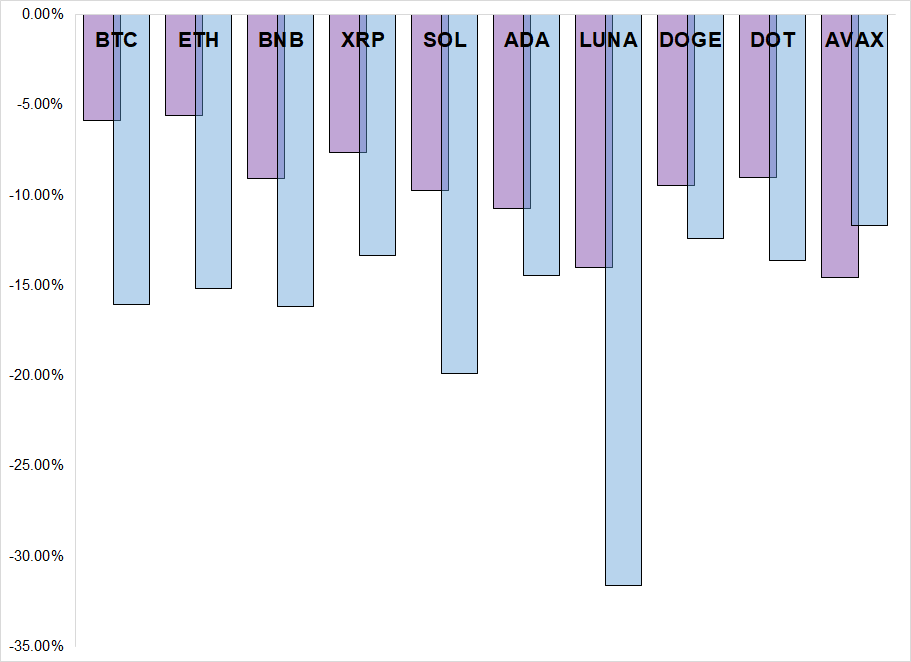
Purple is 24-hour performance, blue is 7-day
This is not a scientific examination of the cross-coin correlation in crypto but I can assure you that this is highly representative. Here are the Pearson correlations for the top 10 coins over the last 30 days.
Cross-crypto correlation is high, especially in times of stress
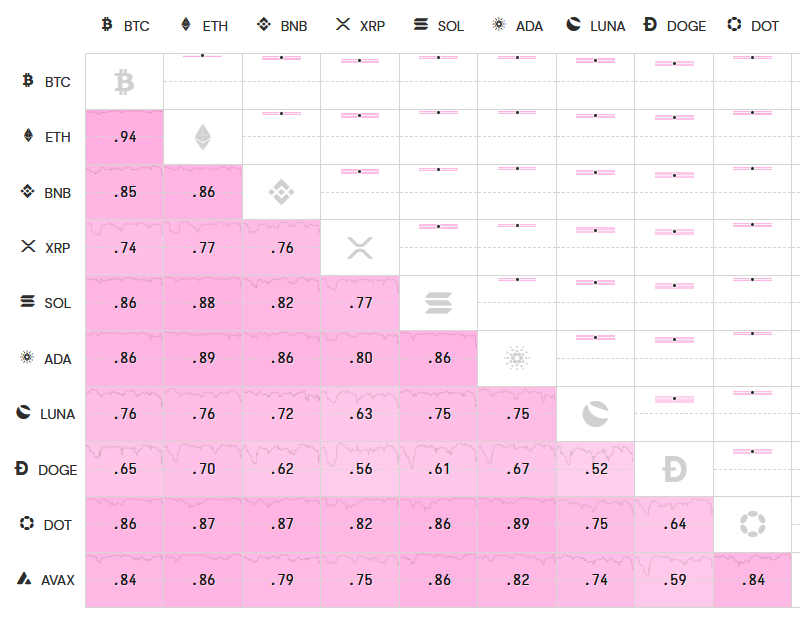
Source: https://cryptowat.ch/correlations
Again, correlation is not static. In periods where the Fed is in control of the narrative or when volatility is very high, coin-to-coin correlation is going to be high. When an altcoin has a narrative that is at the forefront of traders’ imaginations (LUNA FUD now, Solana summer last year, etc.) … That altcoin will have much more idiosyncratic movement.
To reiterate: Correlations come and go. They go up and down. Be aware of the current correlations and don’t stick your head in the sand hoping for BTC to be a safe haven. Maybe it will be one day, maybe it won’t. For now, it isn’t. If you are a long-term HODLer or investor, you are pursuing the beta buy and hold strategy, and none of this matters. If you are a trader trying to generate alpha, it matters.
OK, so what?
Once you understand the basics of correlation, you can start to figure out:
- What is driving crypto in general? Is it a crypto adoption and use case story, a Fed story, or something else? Currently, it’s obviously a Fed story along with an overinvestment, end of the euphoria, moving to despair story.
- How are correlations changing? Changes in correlation can be massive signals of a regime change. After Crypto Winter, the bull story was about adoption. After COVID, the bull story was about Fed policy. Therefore the end of Fed easing signaled the end of the crypto bull market. This is not hindsight, I wrote about it here (warning signs), here (Nobody will ever tell you when to sell), and here (Buy some mittens, get ready for winter). Macro works in real time.
- When macro is in control, idiosyncratic stories don’t matter as much. You might be right about the potential of P2E or the metaverse, but you’re still losing money in AXS, SAND, or MANA when the Fed is in max hawk mode. This is similar to what often happens in commodities markets as in-the-weeds supply/demand experts get steamrolled by macro factors like the USD, China/US Trade War, or inflation panic. Bottom-up analysis (e.g., which L1 or L2 tokens are best?) is great, but unless you get the top-down right, the bottom-up often doesn’t matter.
- If you want to completely avoid global macro and Fed, trade relative value by shorting the tokens you hate and going long the ones you love. Then, you have no beta to the overall market. This is what long/short equity funds do in the stock market (though they often don’t fully hedge, they might maintain a long bias of, say, 130% long: 30% short).
Conclusion
I know that most people are aware of the correlation between the NASDAQ and BTC. I hope this piece gives you a deeper understanding of that correlation and gives you a few signposts to watch for going forward.
Thanks for reading!
MTC goes paid on June 1. The cost will be $199/year for new subscribers and $99 for you (that is a 50% discount to say thanks to everyone on the free list right now). I will let you know how/where to sign up in the next issue of MTC.
Thanks again.
Further reading: Here’s a related piece I wrote in April 2021. It’s called “What Causes Cross-Market Correlation?”