Today’s piece is a bit longer than usual. 2000 words, 8-minute read.
Talking about variance.

Today’s piece is a bit longer than usual. 2000 words, 8-minute read.
Talking about variance.
September 14, 2022
If you listen to sports radio in NY, you will know that there is a lot of angst about the Yankees as they have dropped a 15-game lead in the American League East and now only lead by 6 games. A topic that fails to come up in the discussions of why the Yankees “suck right now” is: variance. A good team in baseball generally wins 58% to 68% of their games. With that win%, there are going to be some ups and downs. It doesn’t mean the manager is bad or the hitters suck, or the pitchers need to be more clutch. It’s just variance.
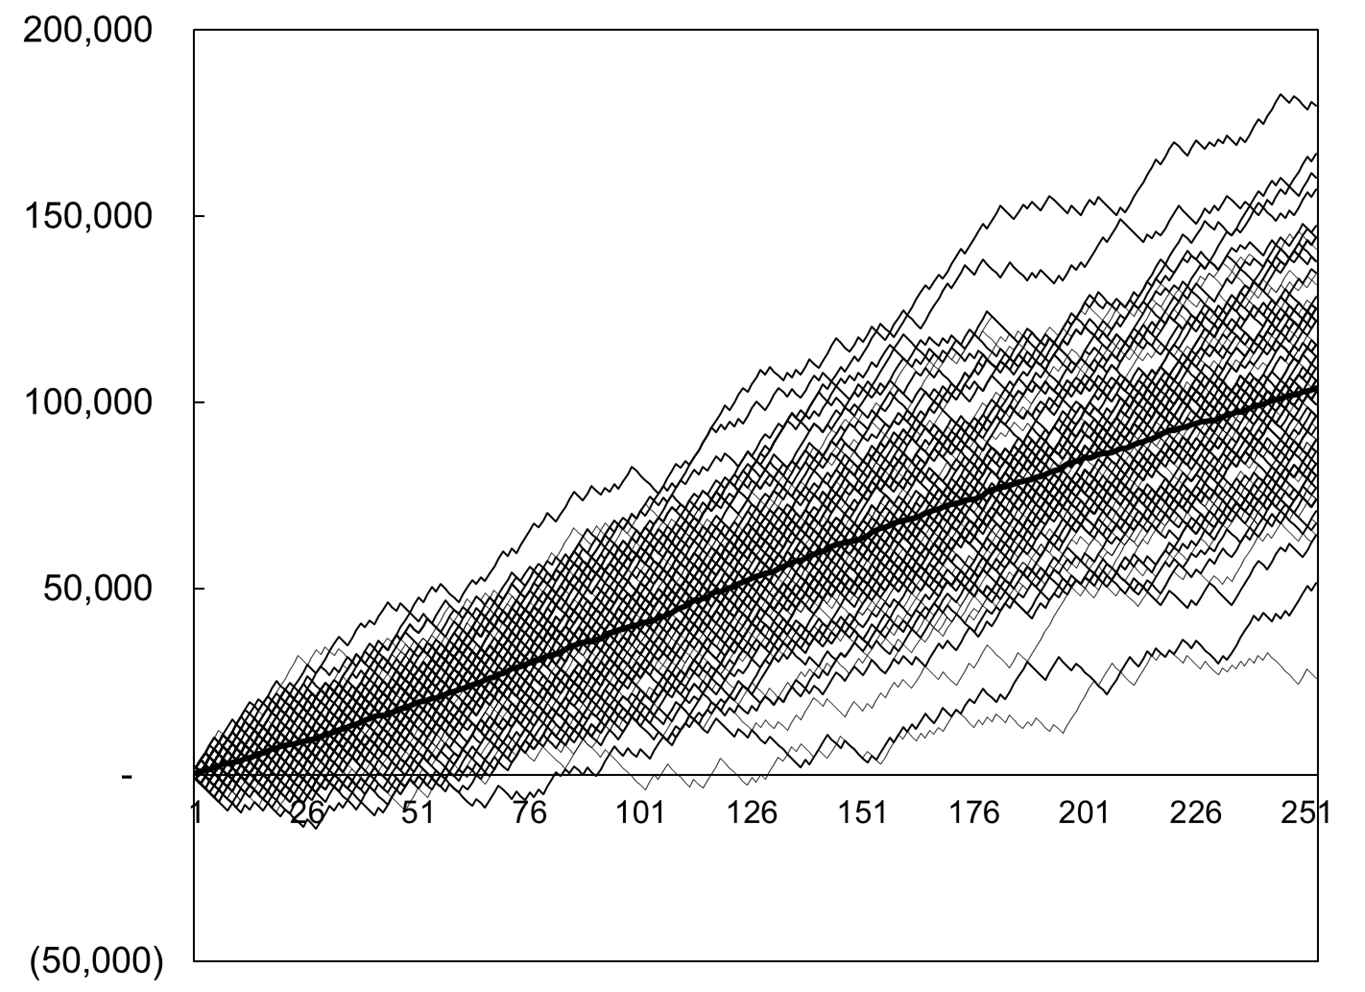
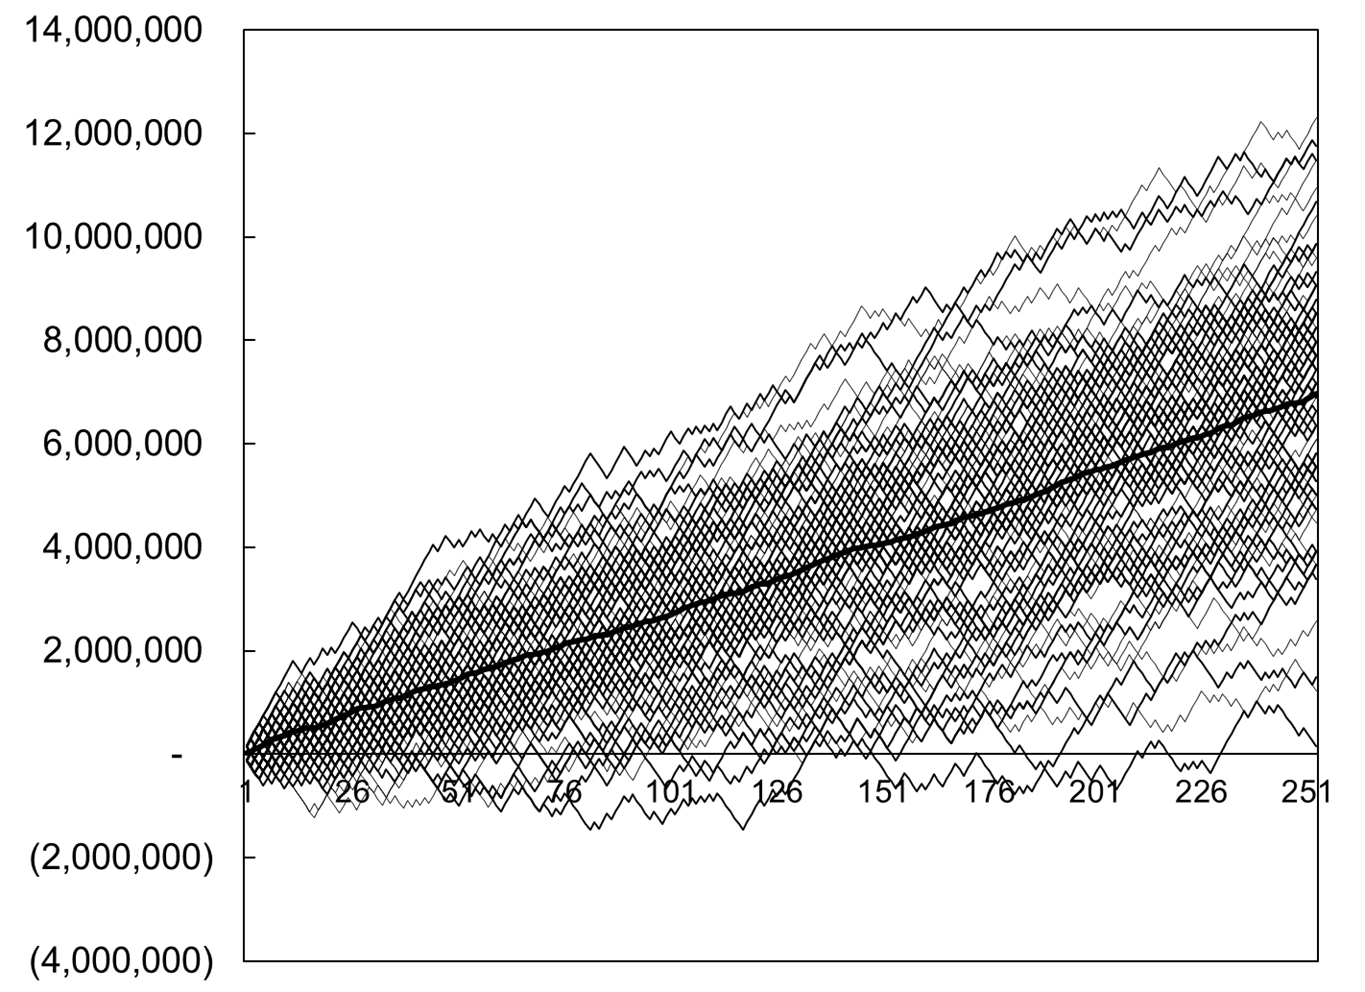
Here are 50 season-long simulations of cumulative wins for a team with the same win% as the Yankees right now (60.3%).
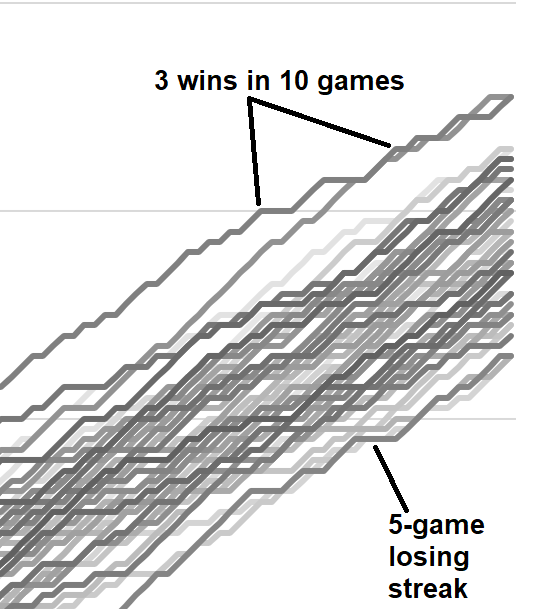
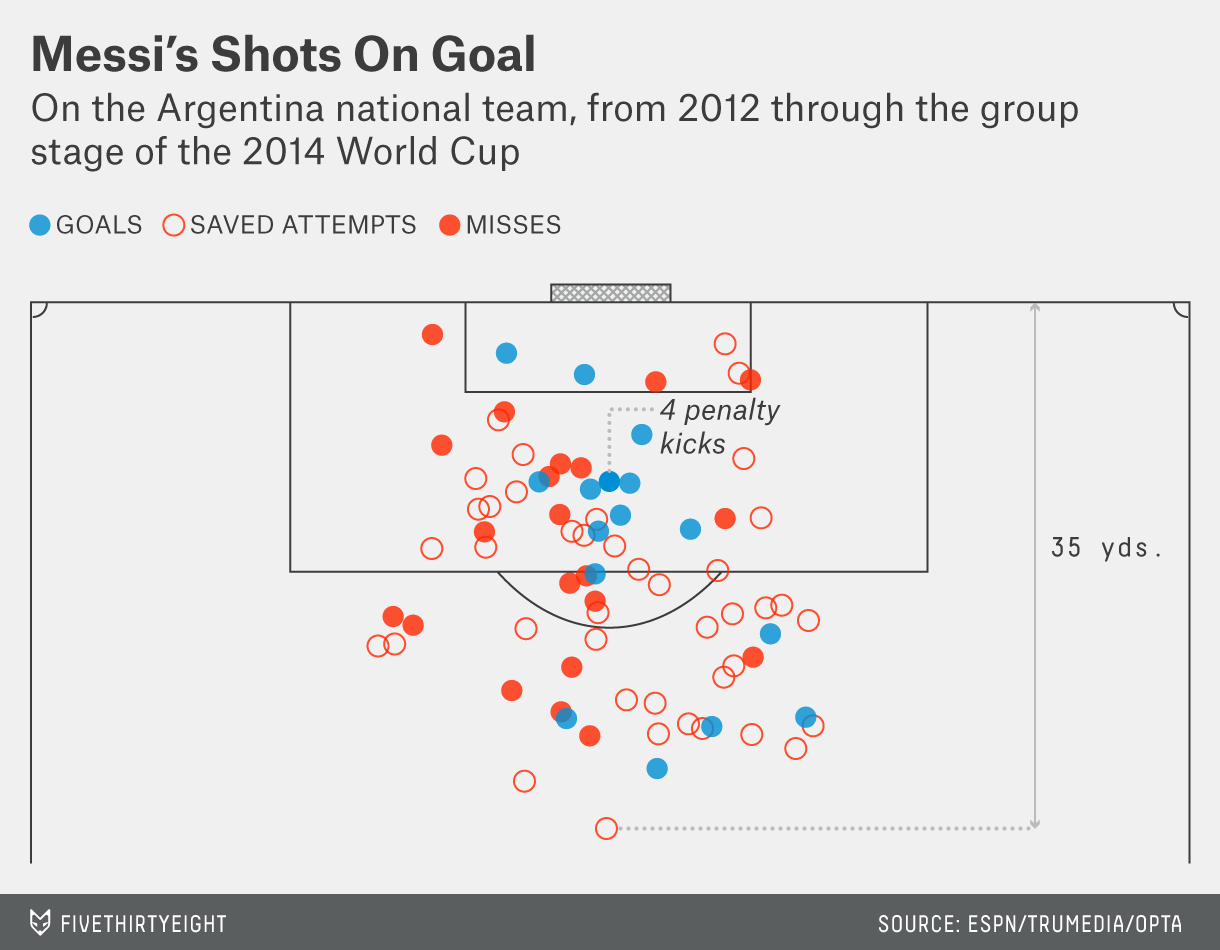
They win somewhere between 85 and 111 games. They have losing streaks of five games fairly often. They lose 7 out of 10. And so on. It’s mostly variance. Just like Messi doesn’t score on every shot!
Or how about this running win probability for the Steelers / Bengals game this weekend as the kickers missed a bunch of potential game-winning field goals:
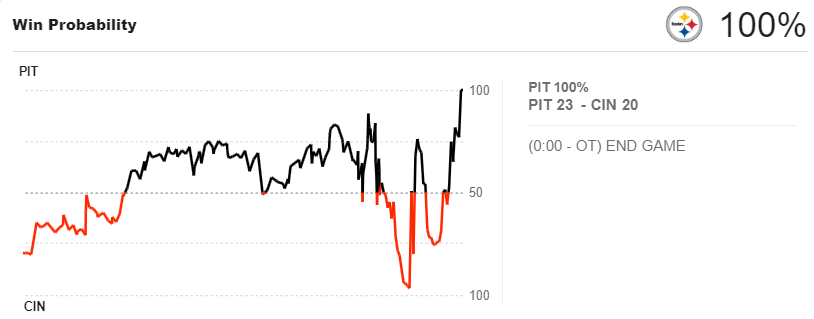
The result of this high-energy game involving huge men with years of intense training crashing into each other for three hours was pretty much a coin toss. The post-game analysis praised the steely nerve of the Steelers kicker who came back to kick the game winner after missing one earlier. But it’s just variance.
Most of this next section is excerpted from Alpha Trader.
While the world of sports has a terrible understanding of variance (or ignores it intentionally to sell human narratives of glory and defeat) … The world of finance isn’t all that great at understanding it either. I would say I was well into in my 30s before I really started to realize how important and all-pervading variance is in trading and economics.
The laws of probability, so true in general, so fallacious in particular.
– Edward Gibbon, 1774
In statistics and probability, variance is the concept that in a series of numbers with a given average, individual data points will be spread out away from the average. So even if your average daily P&L over the last 10 years is +$23,000, you might still lose $25,000 five days in a row sometimes. This may not mean you did anything wrong. It’s just variance.
Variance is a prominent feature in poker. A well-rested professional poker player will inevitably beat a drunk amateur over a long period, say 12 hours. But over any 10-minute or even 30-minute period, the drunk amateur might prevail. The key to understanding variance is that it is most visible in short samples. The larger the sample, the closer the aggregate data will approach the true average.
Luck is a short-term thing. In the long run, skill prevails.
Then again, as Keynes famously said… “In the long run, we are all dead.” A very solid trading strategy with significant edge generates substantial variance, even year to year. This is why it is incredibly difficult to evaluate traders, portfolio managers and hedge funds. Was it luck or was it skill? Michael Mauboussin’s book: The Luck Equation: Untangling Skill and Luck in Business is the go-to book on this topic.
To give you a sense of how variance impacts a year of performance in trading, let’s run a few simulations. For simplicity, we’ll use a static risk management approach where the trader does not change their risk appetite during the year, regardless of performance. That said, I strongly advocate increasing your risk as your P&L rises.
I include these simulations because I think very few people, even expert traders, truly appreciate just how dramatic the impact of variance can be on performance. It is probably a defense mechanism. If we truly appreciated how important variance was, we would feel like we barely control our own fate. And humans love to believe they are in control.
The first simulation approximates the performance of a retail trader. She makes money 50% of days and loses money 50% of days. Her average winning day (net P&L) is +$2,000 and her average losing day is minus $1,200. Based on these figures, she will expect to make $100,800 in an average year. Here is her cumulative YTD P&L simulated 100 times.
The same trader using the same strategy in a world with the same probabilities might make $50,000 one year and $150,000 the next, with variance—and literally nothing else—to blame.
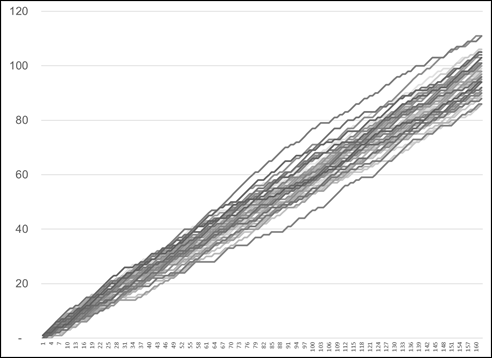
The second simulation represents a bank trader. He makes money 55% of days and loses money 45% of days. His average winning day (net P&L) is +$150,000 and his average losing day is minus $120,000. Based on these figures, his expected value is +$7.2 million. But here is how he fares in 100 simulations:
You can see that despite employing a process with substantial edge and positive EV, a trader’s annual performance is all over the place simply due to variance. This is a big reason why it is so flipping difficult for management to properly assess traders and for traders to evaluate themselves. It’s easy to be fooled by randomness!
One of the most difficult and most important skills in trading is the ability to distinguish between variance and bad decision making. If you are losing money right now, is it because your process has broken down, your discipline sucks and the market has completely changed? Or is it because of the inevitable variance within the P&L distribution?
When you are on a bad streak, you need to ask yourself this. The longer you have been trading, the easier this is to answer (usually). For me, I can usually look back on a losing streak and determine with a fair amount of confidence whether it was variance. When you are starting out, it’s almost impossible to tell.
Here are some examples of how I look at a losing streak and determine whether it’s a product of variance or bad process.
Variance
When I am wrong and I lose money, I barely care. That’s trading. As long as I have been sticking to my risk management system, I shrug and move on. Being wrong is where variance comes from in trading. Don’t worry about it. On the other hand, some things can’t be attributed to variance.
Not Variance
If losses stem from any of 1 to 9 above; that’s not variance. That is bad trading, bad process or bad mindset. Cut all your risk and figure out how to get things back on track. When you trust yourself to do the right thing, you are trading well. It should not matter all that much whether you make or lose money on any given day.
When you are trading with a good mindset, you see each trade and each day as a series of independent events with a probabilistic nature and you understand that some trades and some days you will lose money. Each day, you come in and do your best without getting too high or too low. You invest most of your energy in the process and very little in the outcome. Each trade, you go through a thoughtful process and execute in a rational and systematic way.
If you trade sloppy, don’t say “I suck” or “I traded SO bad today”. Instead ask: “Why was I so sloppy today? Am I burnt out? Discouraged? Disengaged?” Robotic application of a process keeps you sane and lets you know you can trust yourself. If you break your stop loss repeatedly, you should quickly figure out why. Bad discipline? No automation of stop loss? Don’t care anymore?
If you go through the above lists (variance vs. not variance) and are still not sure whether a recent losing streak is caused by variance or bad trading, take a step back. The more experience you have, the easier it is to make this determination but if you are new, it can be very difficult, especially if you tend to be critical of yourself.
Traders with a healthy mindset who are confident in their process have a much easier time dealing with losing streaks because they can confidently identify the cause as variance and move on. Traders with a less healthy mindset or less confidence will tend to assume that a losing streak is the result of bad decisions and a lack of trading skill.
Alpha traders with a solid process and excellent risk management still hit losing streaks. In the long run, a solid process will win but in the short run, there are always going to be ups and downs due to variance. If you make money 50% of days, you can expect to lose money 6 or 7 days in a row once in a while. That is fine! When you lose money six days in a row and determine that it is simply because of variance, you need to double down on your process and believe in what you are doing more than ever. Variance can be managed, but never controlled.
Get comfortable with variance.
If you understand your edge and can confidently explain it, you will be much more comfortable with variance. Furthermore, if you continually spend time thinking about the current regime and how to adapt to present market conditions, you will reduce your variance and maintain steadier performance over time. No matter how good you are, though, you still need to understand that variance is a thing.
Variance is also an important factor when examining economic data. Remember when economists were saying the Household Survey was telling a different story than the Establishment Survey and that was a signal of imminent doom for the jobs market? Below I show the Establishment Survey result (NFP, dark blue) and the Household Survey result (light blue).
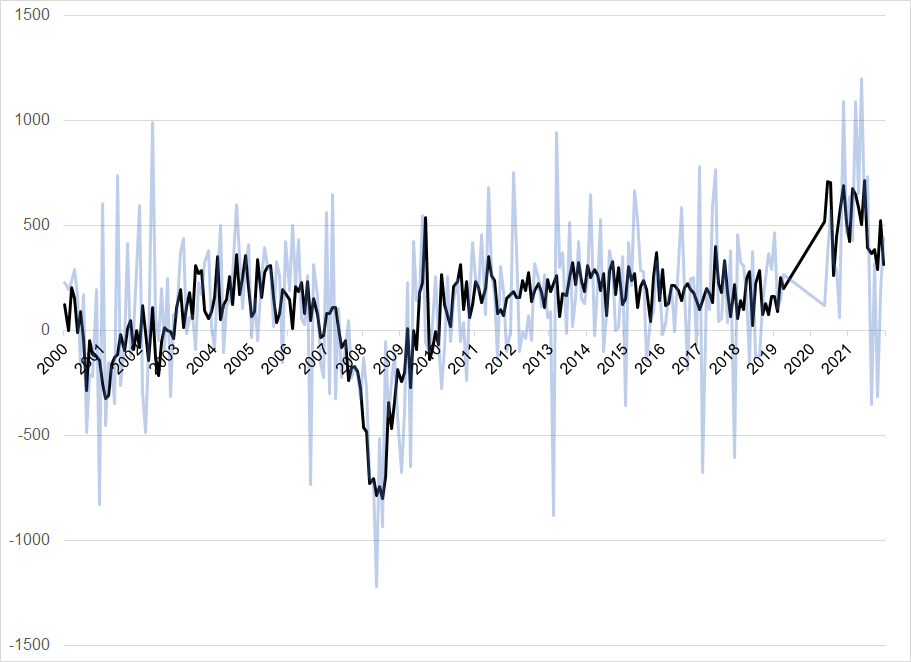
It’s just variance! Make sure you understand the variance of the economic data series you’re looking at so that when there is a miss, you have a sense of whether it’s signal, or noise.
Annie Duke’s “Thinking in Bets” is one of the best books on understanding variance.
Have an ace day.
Poker is the ultimate study in variance. Skill dominates the long run, but luck dominates the short run.
This week was not for the faint of heart as we saw a toxic mix of small, medium, and large geopolitical, macro, and idiosyncratic shocks.

Scary blowoffs like we just saw in USDMXN are usually the end of the move, not the start of something bigger.
The second half of April is likely to be much less exciting than the first half but the next few days could remain spicy as Williams says rate hikes are not off the table.