The US still seems to be in soft landing mode, and China’s stock market is not the economy.
Push and Pull
It was a week of crosscurrents and contradiction

The US still seems to be in soft landing mode, and China’s stock market is not the economy.

Hello. It’s Friday. Thanks for signing up. I’m Brent Donnelly.
Here’s what you need to know about markets and macro this week
Don’t forget to listen to the podcast this week! There is a nice surprise in there for listeners, related to our October 26 conference. It’s called Macro Roadmap 2025, and it’s open to the public. Check out all the details right here:
https://www.spectramarkets.com/macro-roadmap-2025/
Let’s go!
America took the macro baton from China this week in global macro as the real data (JOLTS, Claims, ADP, and NFP) all show a resilient jobs market reminiscent of 2017/2019, while the survey data continues to put up false economic warnings fruitlessly seized upon by bears.
There was a bit of angst around the Manufacturing ISM this week as that employment sub-series cratered, but it’s important to know what data matters and what does not. Manufacturing is a less than irrelevant part of the US jobs market. That sector has been contracting for 44 years or so, and there is no reason to care about what’s going on in manufacturing jobs. In ye olden days, manufacturing was a leading indicator for the economy. No mas.
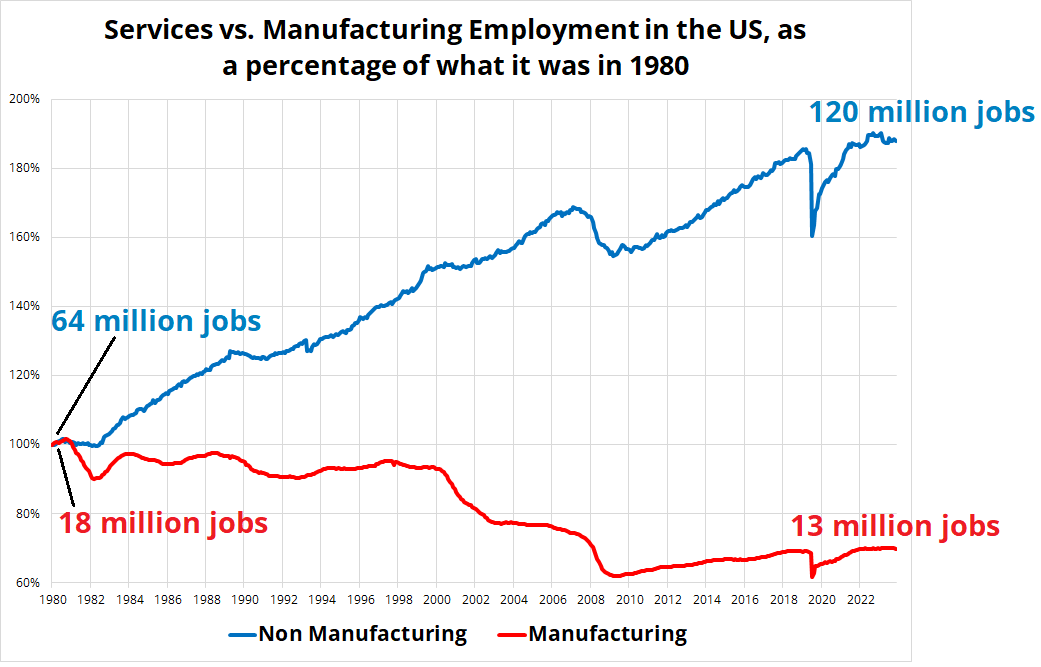
So manufacturing is not important in the US, and sentiment surveys have been broken for at least three years. Should we care about a sentiment survey related to manufacturing? No.
Sentiment surveys are supposed to be useful because they are said to be leading indicators of real economic growth. In the past, they were, but in this cycle, they have not been. There are many oft-discussed reasons for this, but today I wanted to share a mind-blowing chart that took me to the farthest extreme limit of my Excel capabilities.
If you look at ISM Manufacturing, the theory would be that today’s release has a relationship to GDP over the next year. Low and falling ISM means a recession is on the way, right?
I show ISM vs. one-year forward GDP over the decades. The fit was logical, until it wasn’t.
See this scatter plot, with a trendline for each decade.
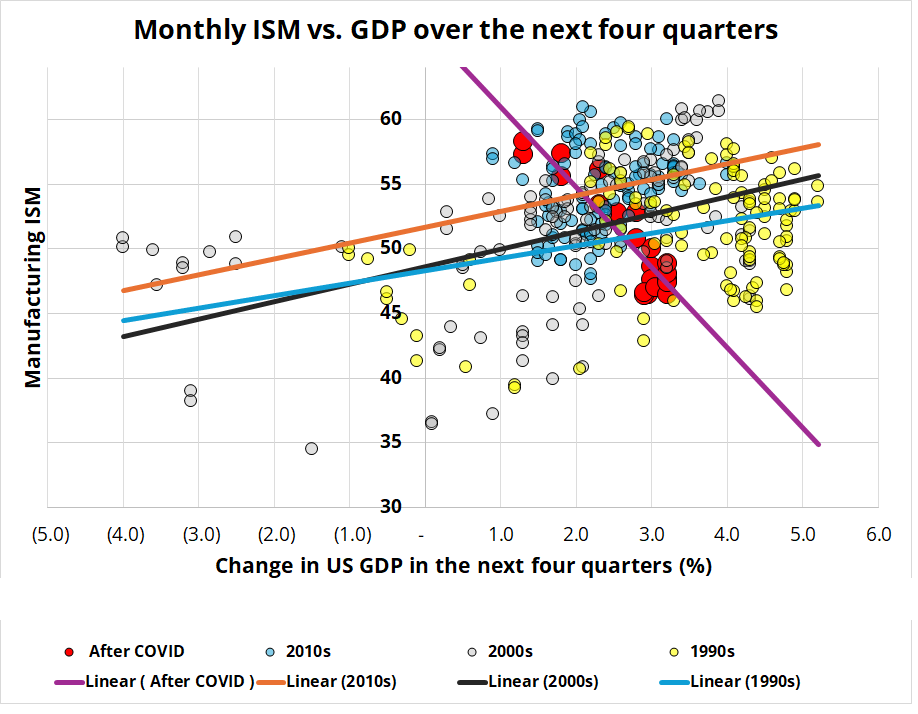
Pretty amazing. The slope in the three decades prior to COVID was moderate and logical. The post-COVID slope is wrong—and steep. As discussed yesterday in am/FX, manufacturing just isn’t the place to look if you’re trying to forecast the US economy. This is not about to change.
Meanwhile, China has been closed all week for the National Holiday and Golden Week travel period. We now wait eagerly for the return of Mainland China to see what magic or lack of magic might ensue.
You can look at the China story right now as purely financial, or you can forecast that the stimulus and rising stock market will filter through to the real economy and we will see some form of global reflation. The fact that every central bank in the world is easing definitely helps the China reflation story, but it’s not even close to a sure thing.
In 2009, there was a massive China stimulus and commodity supercycle, yet Chinese stocks went down. In 2015, there was a massive bubble in Chinese stocks, and that time, commodities went down. Financial asset inflation is not the same as consumer goods or producer price inflation.
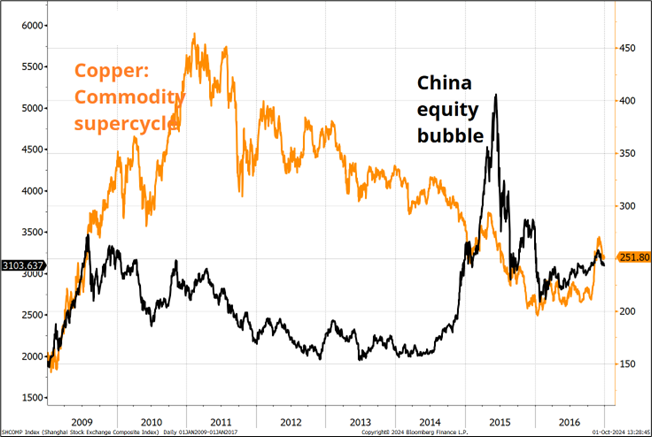
This reminds me of 2009 (because Alf reminded me), when everyone was freaking out about quantitative easing (QE) causing rampant US inflation. QE caused asset price inflation but had no impact on consumer prices. It’s important to understand that financial markets and the economy are sometimes, but not always related.
The inflation freakout in 2009/2010 was one of about a billion examples of doomers turning a bullish development (massive monetary and fiscal stimulus) into bearish fearmongering. E.g.:
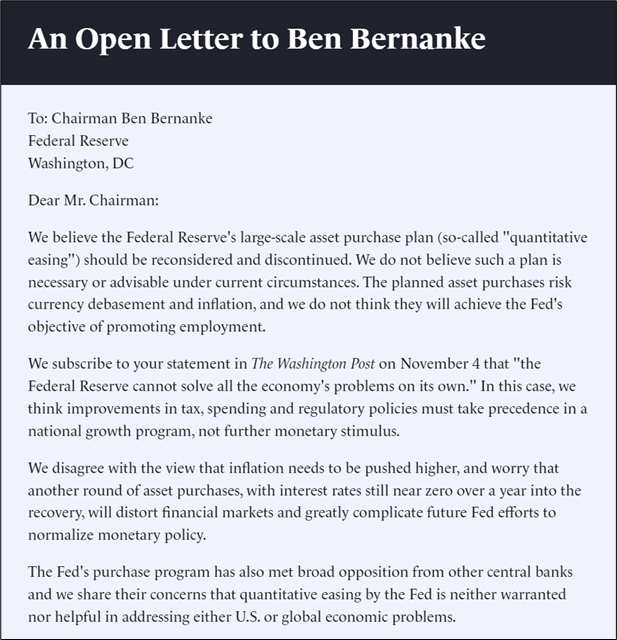
History showed that these concerns from prominent hedge fund managers and economists were exactly wrong. Inflation did not go up, and unemployment peaked the exact month of that letter, then fell from 10% to 4%. Financial stimulus can create a confidence boost from the announcement effect, and it can change economic actors’ behaviors. But it does not, in itself, change anything in the real world. It might. But it might not.
China’s government-led stock market rally brings to mind Goodhart’s Law, which states that when a measure becomes a policy target, it ceases to be a useful measure. Or more formally:
“Any observed statistical regularity will tend to collapse once pressure is placed upon it for control purposes.”
This “law” applies more than tangentially when we start to think of the Chinese stock market as a barometer of Chinese economic health and try to use the Shanghai Composite as a correlated variable with other financial instruments.
A good analogy for using the Shanghai Composite to trade copper from here on in might be: It’s a winter day in Canada. You stand outside in the freezing cold with a hot cup of coffee in your hand. You dip a thermometer into the coffee, watch the mercury rise, then declare that you are bullish ice cream sales because it’s getting hotter outside.
Copper and AUD appear to be listening to the Chinese stock market right now because both are being driven higher by a third variable (Chinese stimulus announcement effect and the Xi put in Chinese stocks). But the stock market is a policy target, and copper is not, so there is no guarantee that once this announcement effect dissipates, Chinese stocks and copper won’t decouple. This is exactly what happened between 2009 to 2016.
Announcement effect sees correlated assets rip… Then… The rubber hits the road. If the third variable (China rebound) performs, they all keep going. If not, they decouple. For all three of AUD, copper, and Chinese stocks to rally, the third variable (Chinese consumption and velocity, etc.) will need to drive them all. Henceforth, Chinese stocks will not drive copper or AUD on their own. They will still be correlated, but their ultimate paths could diverge significantly.
Because of the way correlation works, one thing can go down, the other one goes up, and the correlation is positive. See here.
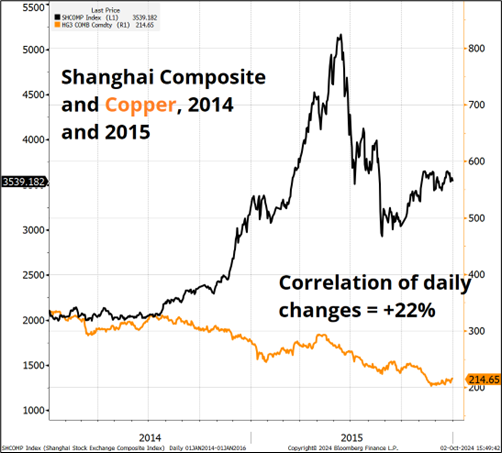
Short copper calls, and short ASHR puts is probably the textbook pair trade here if you know how to risk manage it. Then again, selling ASHR puts almost feels too obvious? Anyway, here’s another example of Goodhart’s Law.
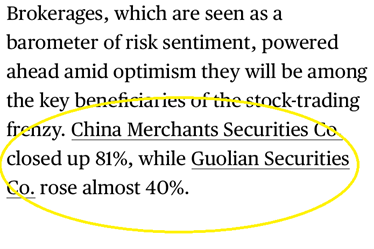
China stocks are still the big story as that once uninvestable asset class (like, 4 months ago?!) is now the global equity darling. As I mentioned earlier, it’s all a bit reminiscent of the 2015 bubble in China. That did not end well, but hey. Let’s see.
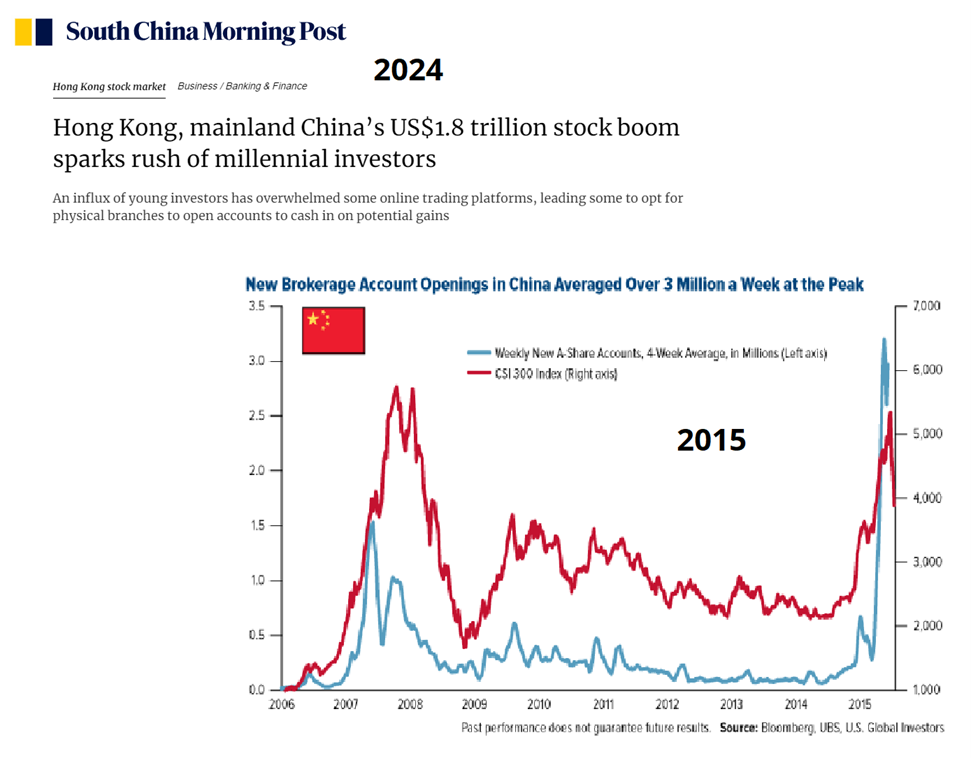
The 25-delta calls on FXI (a China stock ETF that trades in the US) look like this:
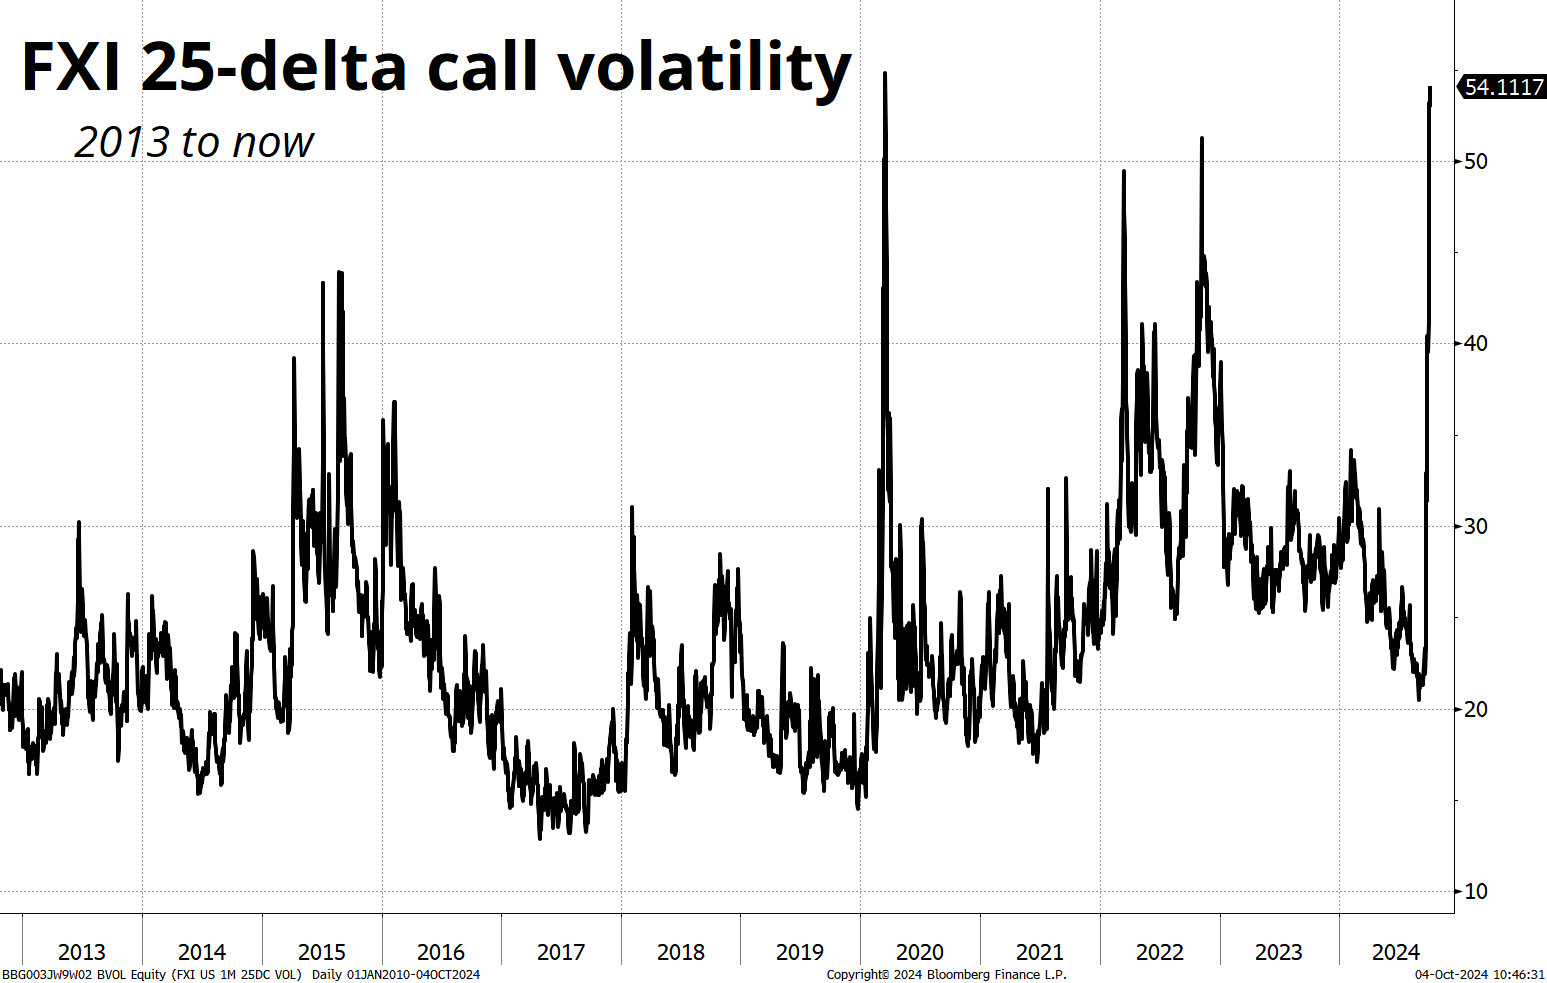
Looking at this chart, one is obviously taken by the similarity to 2015, yet again.
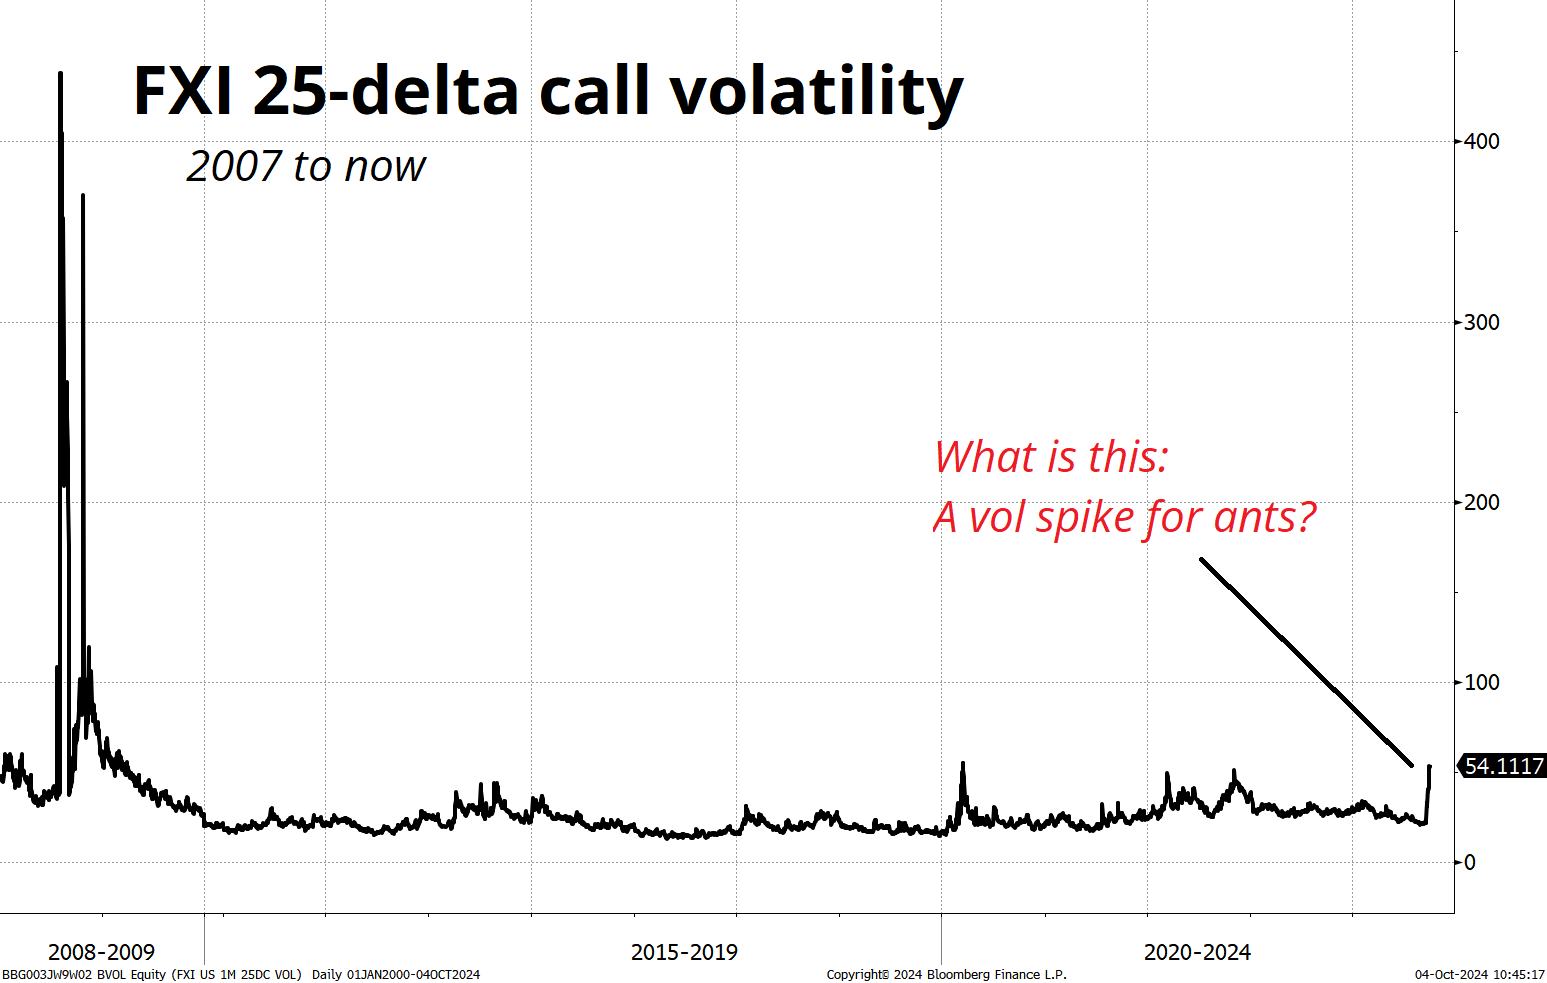
By the way, for those who were not around to trade the 2008 Global Financial Crisis, it’s almost impossible for me to explain or describe how insane it was. There is nothing even remotely close before or after, including the COVID bust and subsequent bubble, the Eurozone crisis, Abenomics, or whatever. Things that normally move 25bps per week were moving 250bps. Every day. It was absolute madness.
Let me rerun that chart from above, including the GFC period. If you didn’t pay attention, go back and look at that chart before you eyeball this one.
In the US, stocks are kind of flatlining as they wait for the bullish seasonal to kick in roughly a week from now.
Here is this week’s 14-word stock market summary:
China flying. US soft landing. Seasonals about to improve. Shorting stocks is hard work.
Do you subscribe to am/FX? If you do, you would have read this on Monday:

In there, I wrote:
This is a huge week for US labor market data, and I continue to believe the market is too pessimistic on US jobs. My view is that we were overheated in 2021/2022, and we are now heading to a more balanced labor market, similar to 2017/2018.
There are many timelines in the multiverse where US 10-year yields end this week between 3.93% and 4.00%.
And here is what happened:
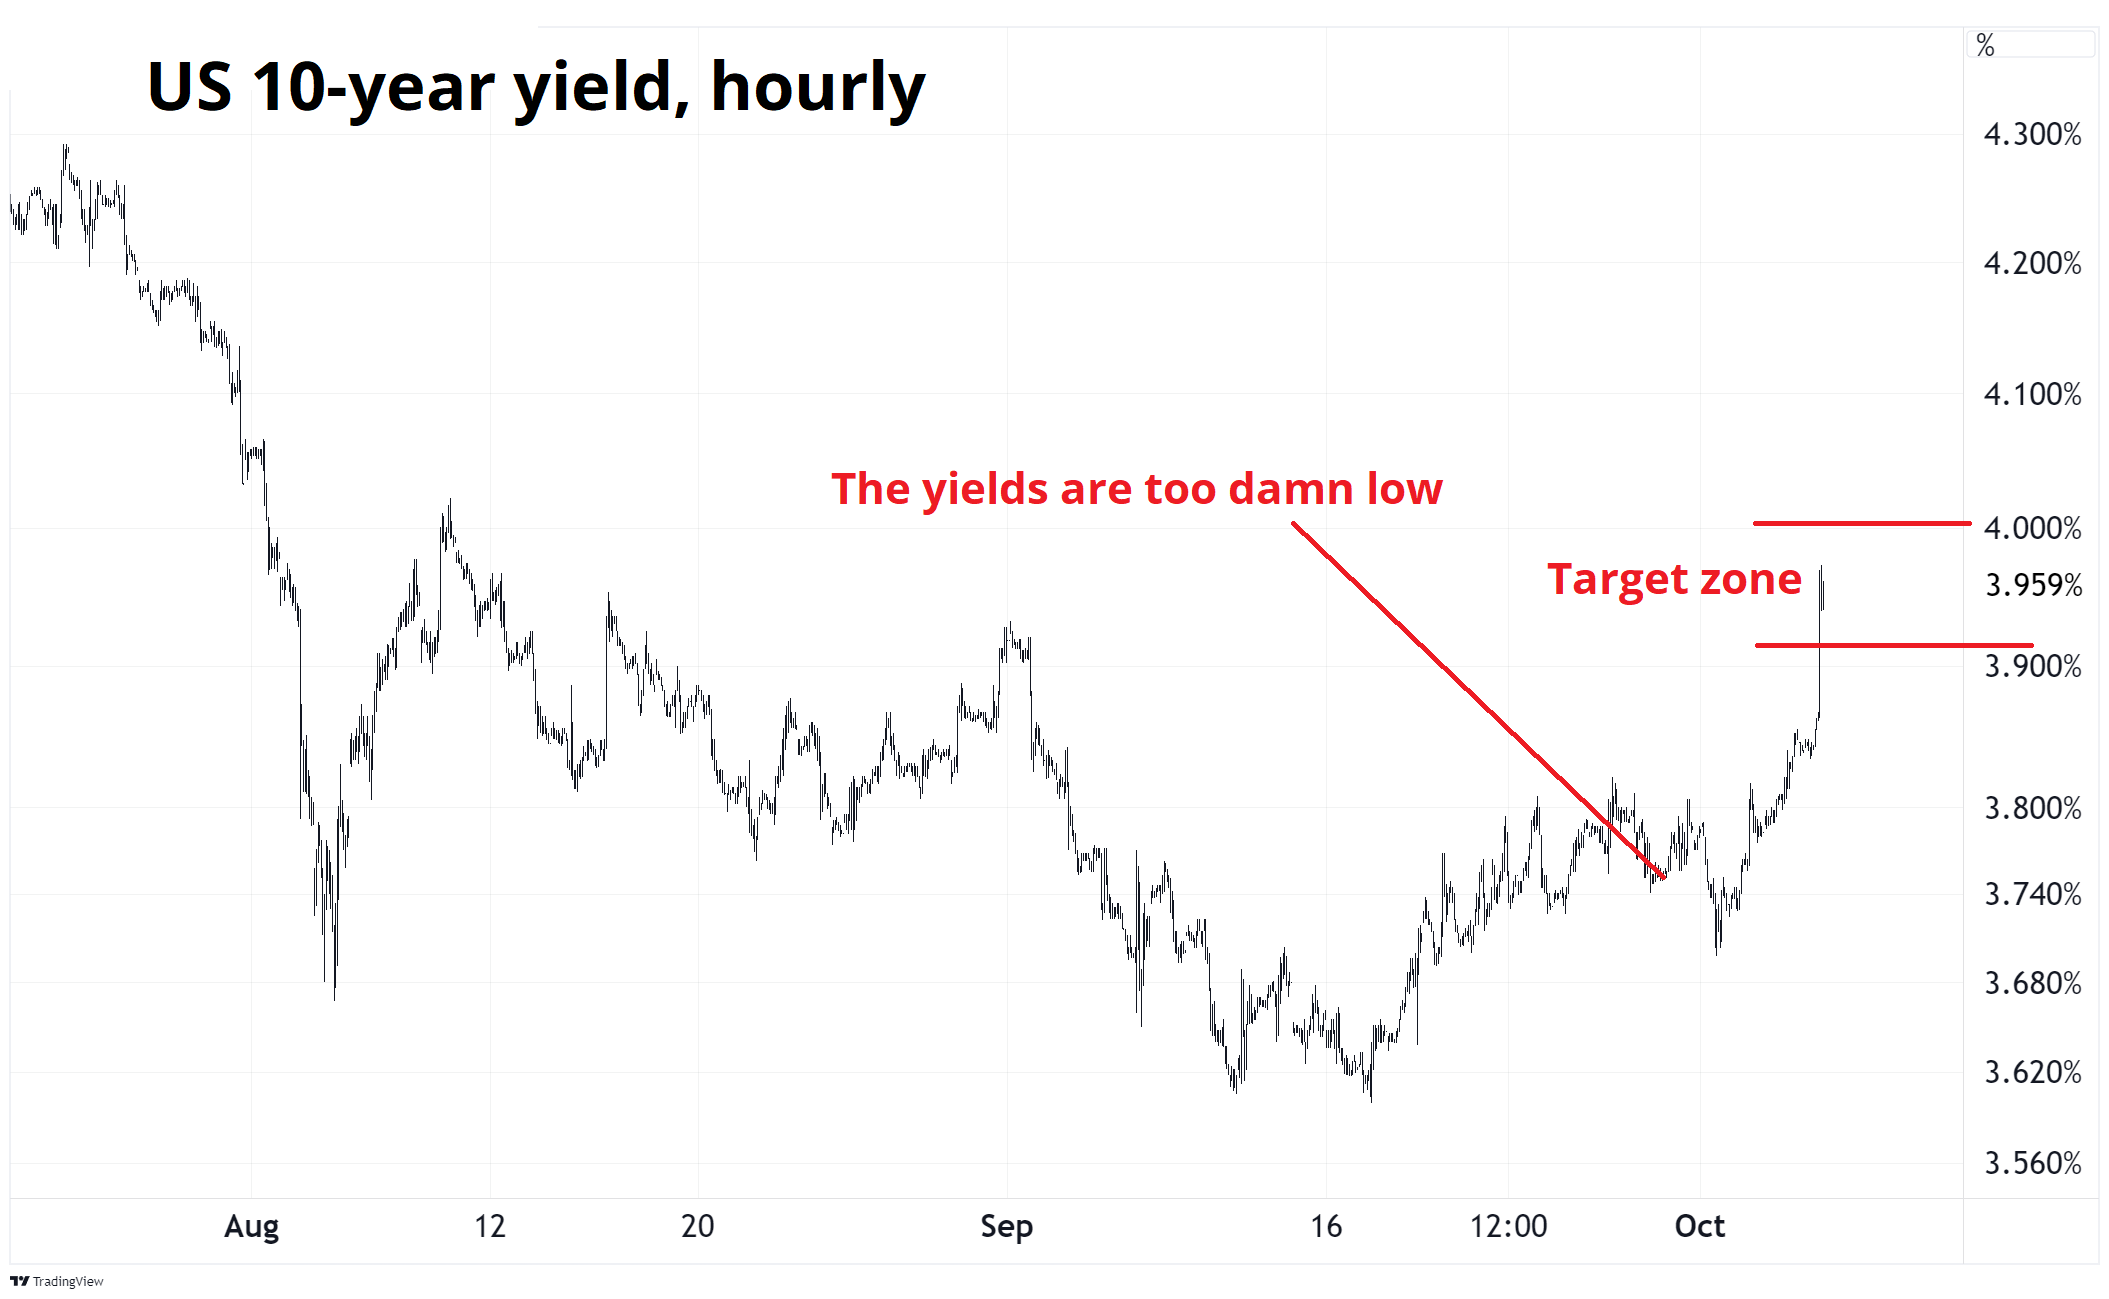
I know victory laps are annoying, but I am trying to encourage people to sign up for am/FX. Sometimes you gotta do a bit of marketing in this business. And I do write about my horrendous calls in am/FX, too, not just my good ones. You often learn more when you’re wrong than when you are right.
One thing you might notice on that chart is the blip lower on Middle East concerns. Trading geopolitical news can be extremely hazardous to your wealth. There is no reliable relationship between markets and what’s going on in the Middle East. Almost ever. We go deeper into why geopolitics = market noise in this week’s podcast.
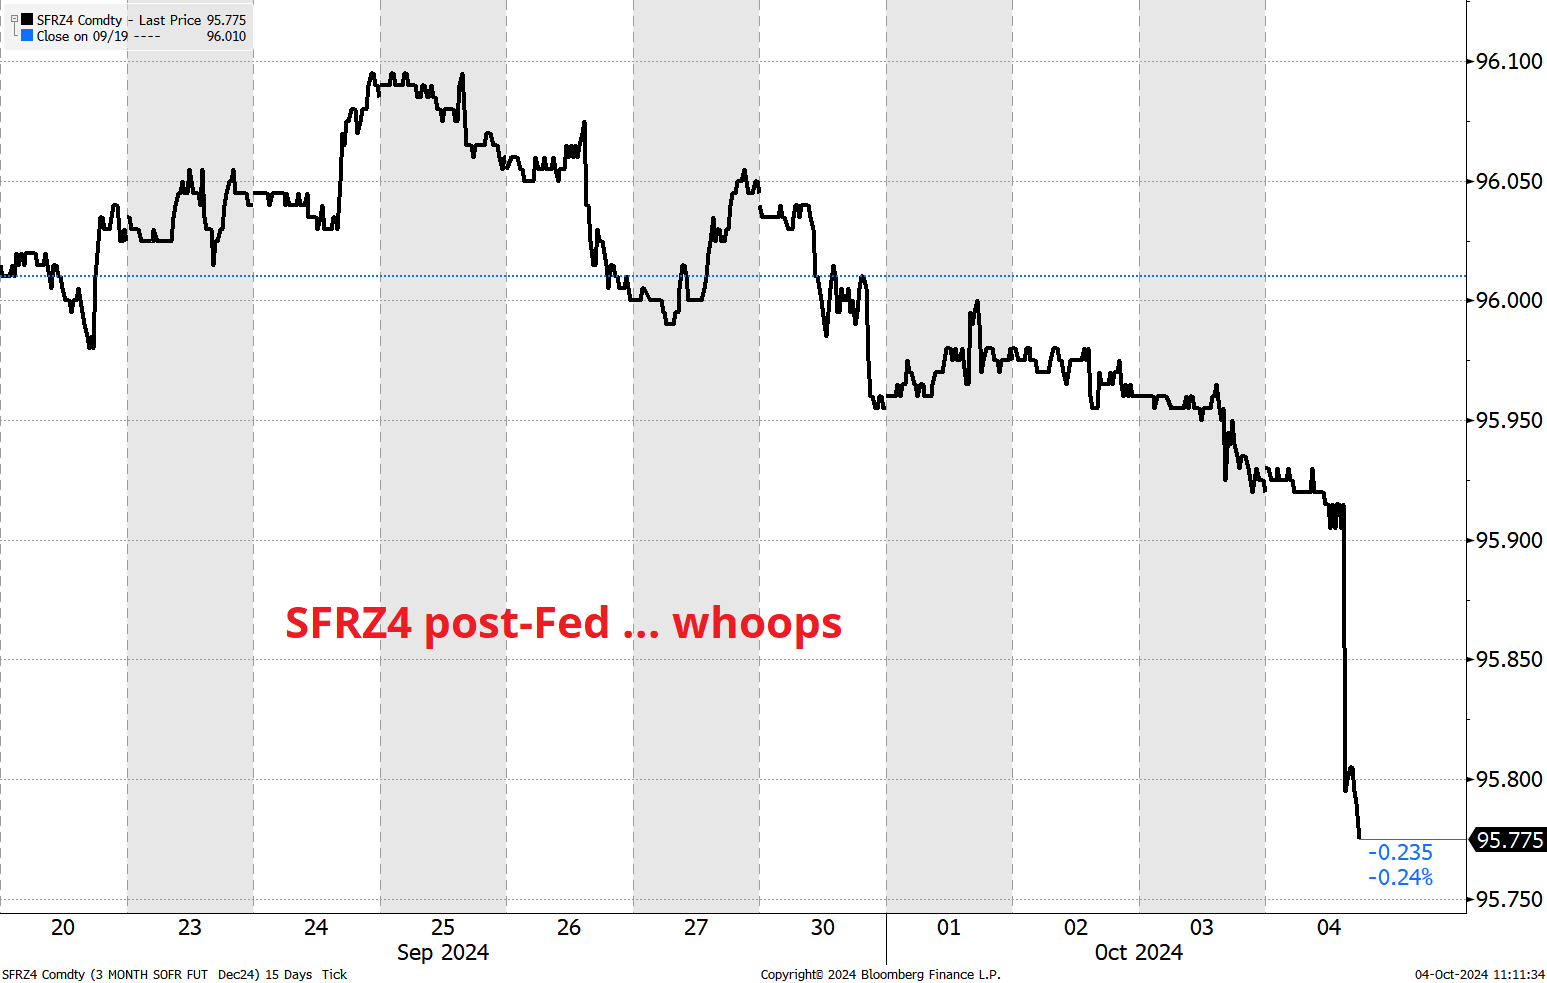
And of course, as the US data storms on, the front end of the US rates curve got **insert synonym for destroyed** this week.
The dollar roared back this week as positioning was extended short USD at the bottom of the range just as the US data continues to show something like a perfect soft landing. Here’s a chart of our proprietary positioning index along with the DXY. You can see that positioning has become extended at the extremes of the range, over and over. This chart was produced before today’s USD rally.
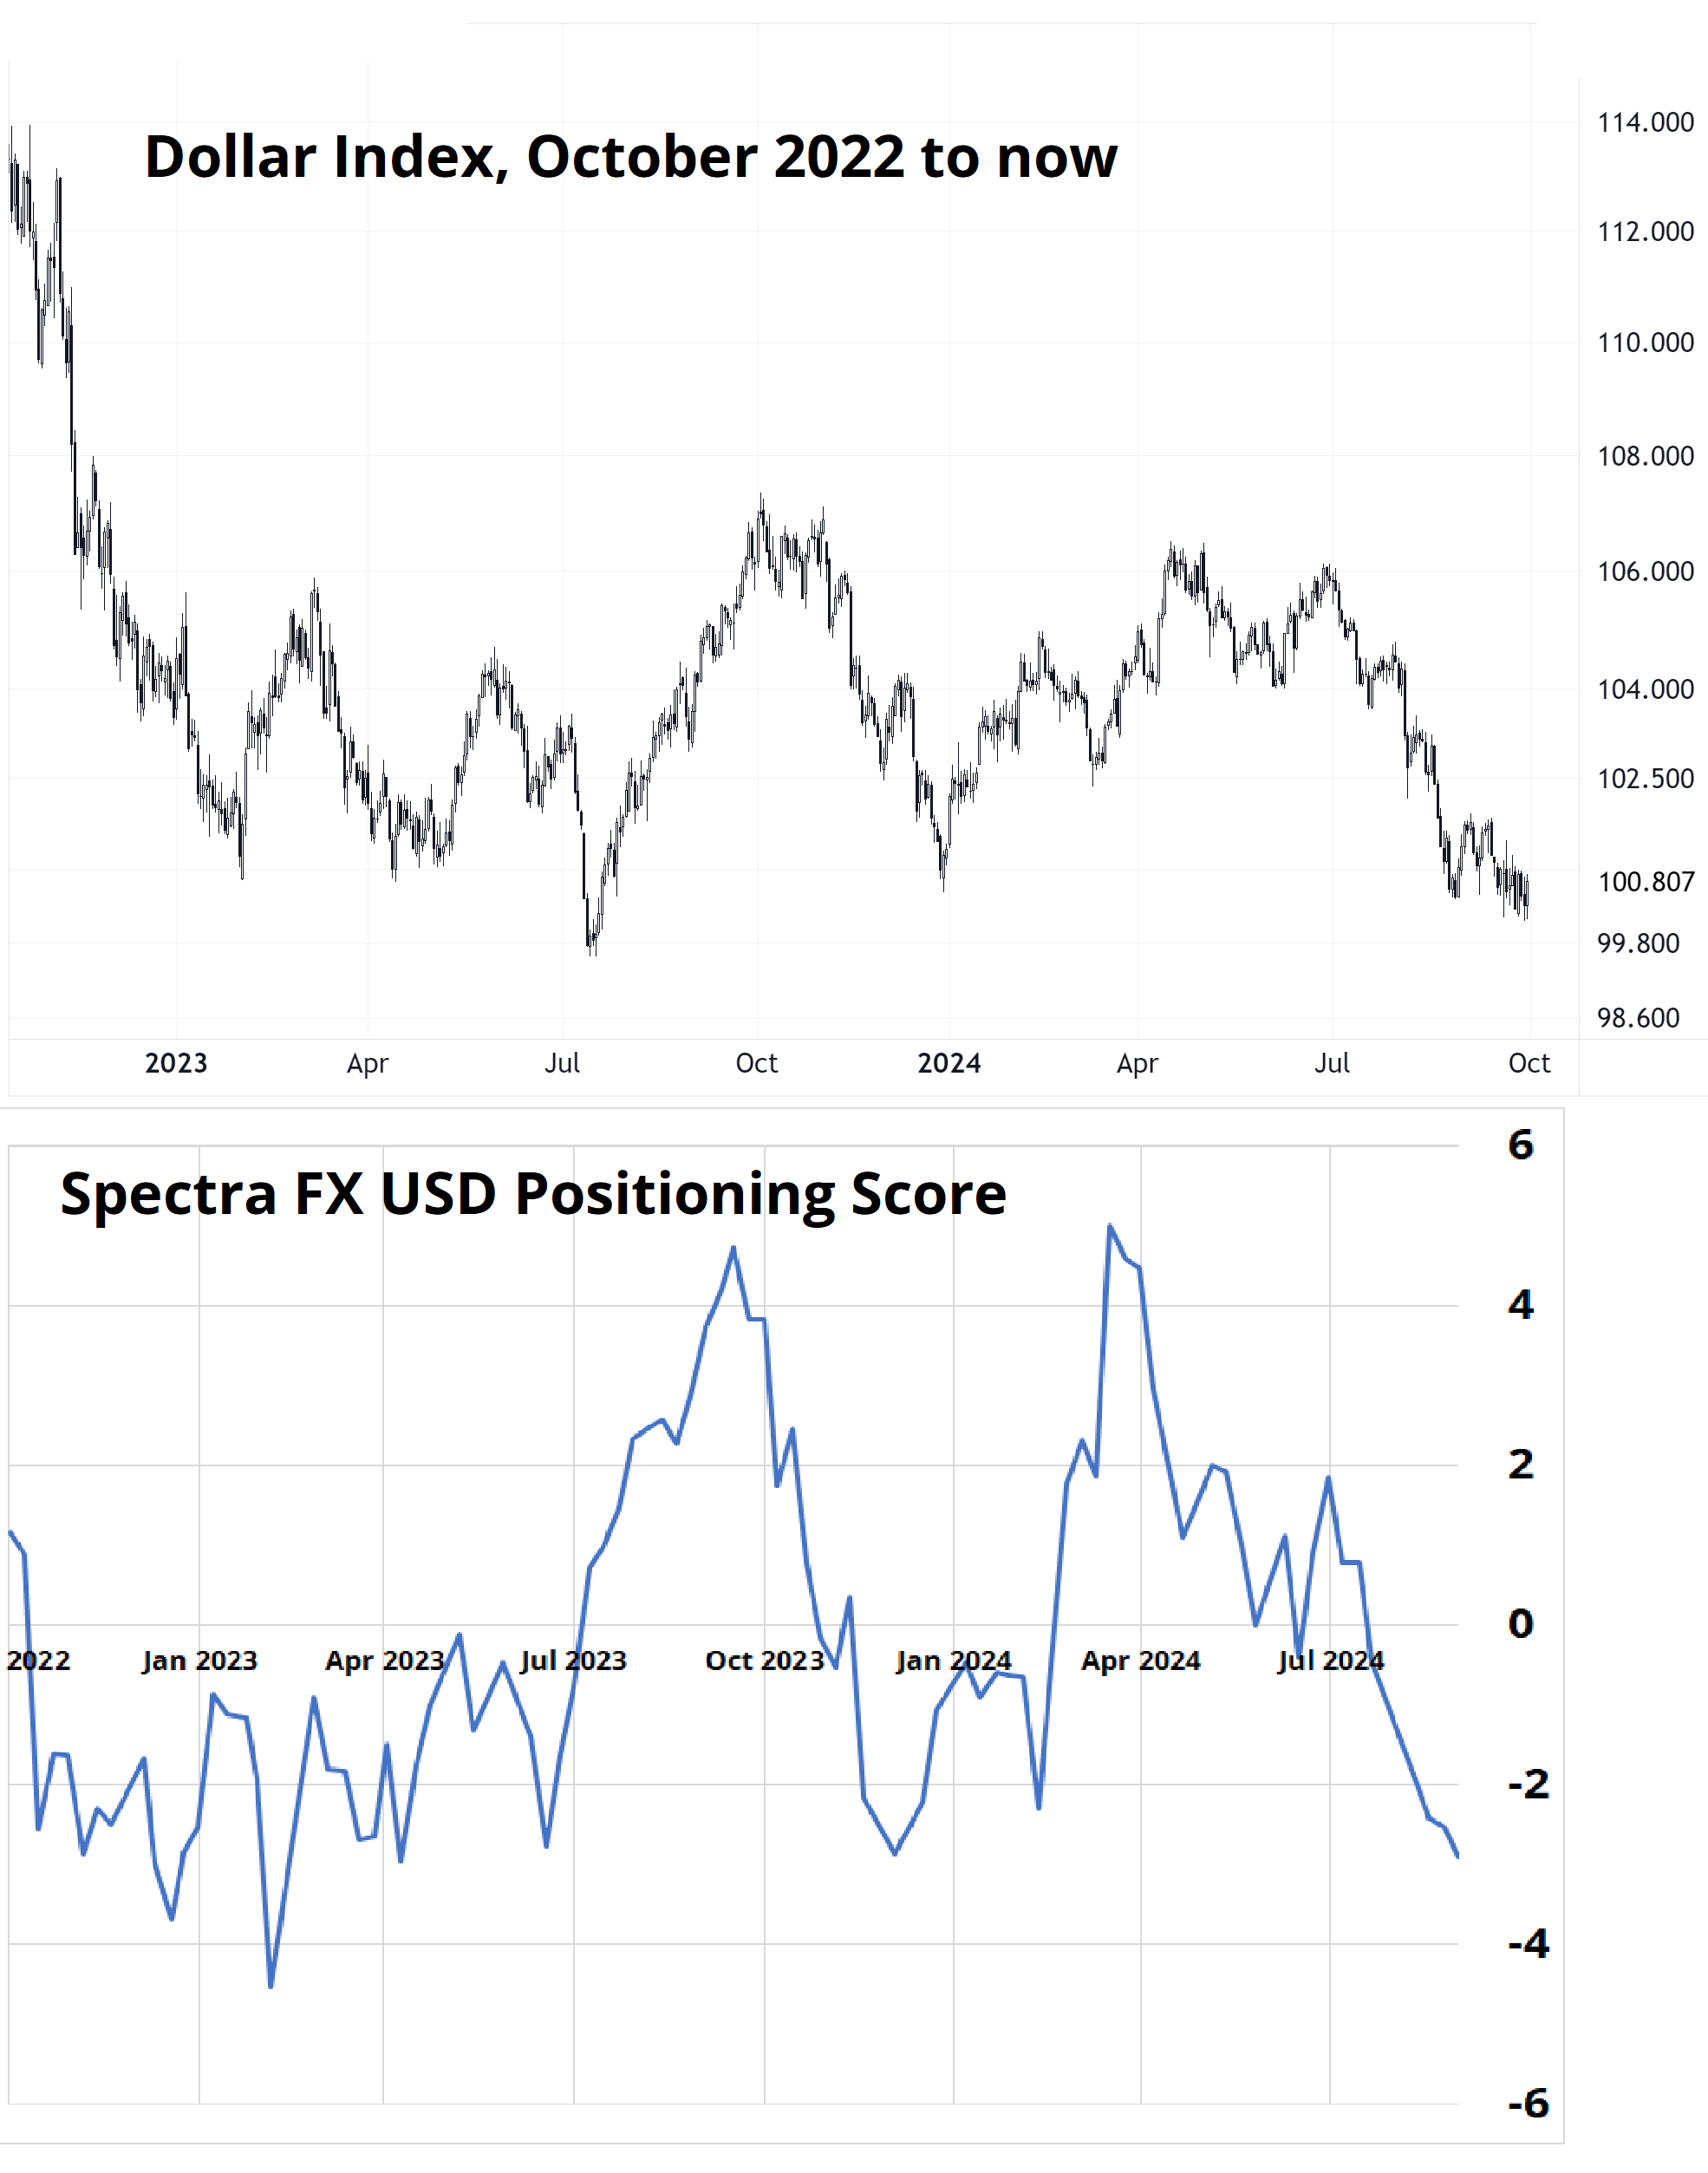
If the USD is going to break one side of the range, you need meaningful news because otherwise the positioning gets extended, you don’t get any sexy continuation style news, and we mean revert.
The juiciest result for the dollar bears would be a Harris victory in the election along with evidence of a meaningful economic reflation trade in China. Harris will trigger some fiscal drag fears, while a reflationary vibe from Shanghai would move us back towards the middle of the USD smile.
Here is a scenario analysis.
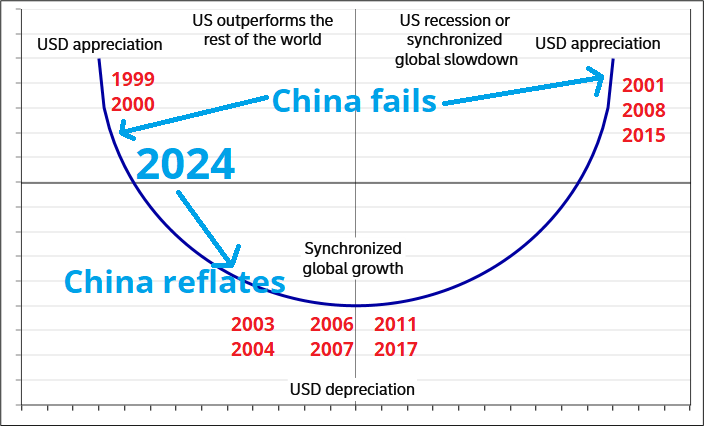
Dollar bears want something like 2003, 2004, 2006, 2007, 2011, and 2017. But they aren’t getting it yet. It would be interesting if a Harris victory coincided with better data from China post-election, because there is a powerful year-end USD SELL seasonal in December. Now that the dollar has rallied, you might want to start thinking about year-end plays for a lower USD. Or, you might want to wait for CPI next week and a reprice to zero chance of a cut in November. :]
REMINDER! Don’t forget to listen to the podcast this week! There is a nice surprise in there for listeners, related to our October 26 conference. It’s called Macro Roadmap 2025, and it’s open to the public. Check out all the details right here:
https://www.spectramarkets.com/macro-roadmap-2025/

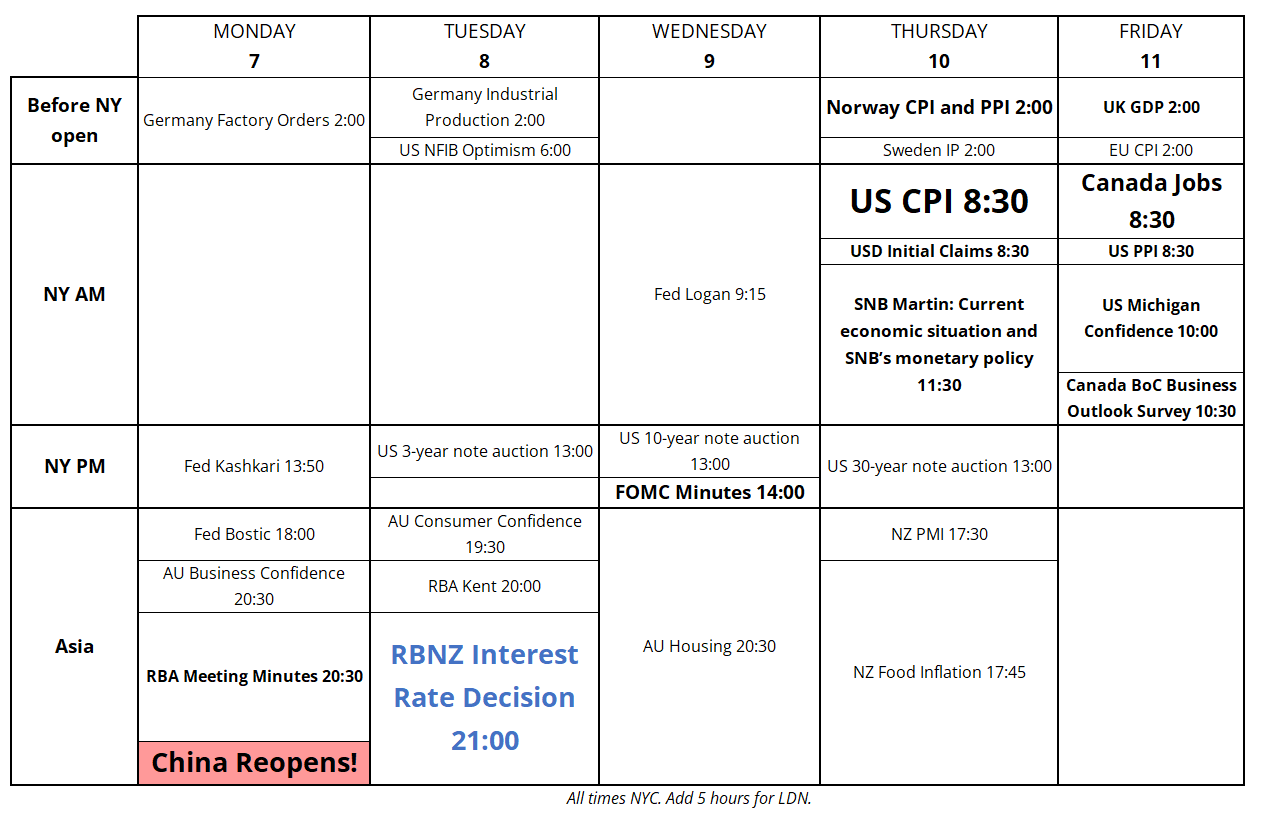
Here is next week’s trading calendar, free of charge.
A bit of a wedge has opened up between bitcoin, and correlated assets like gold and the NASDAQ.
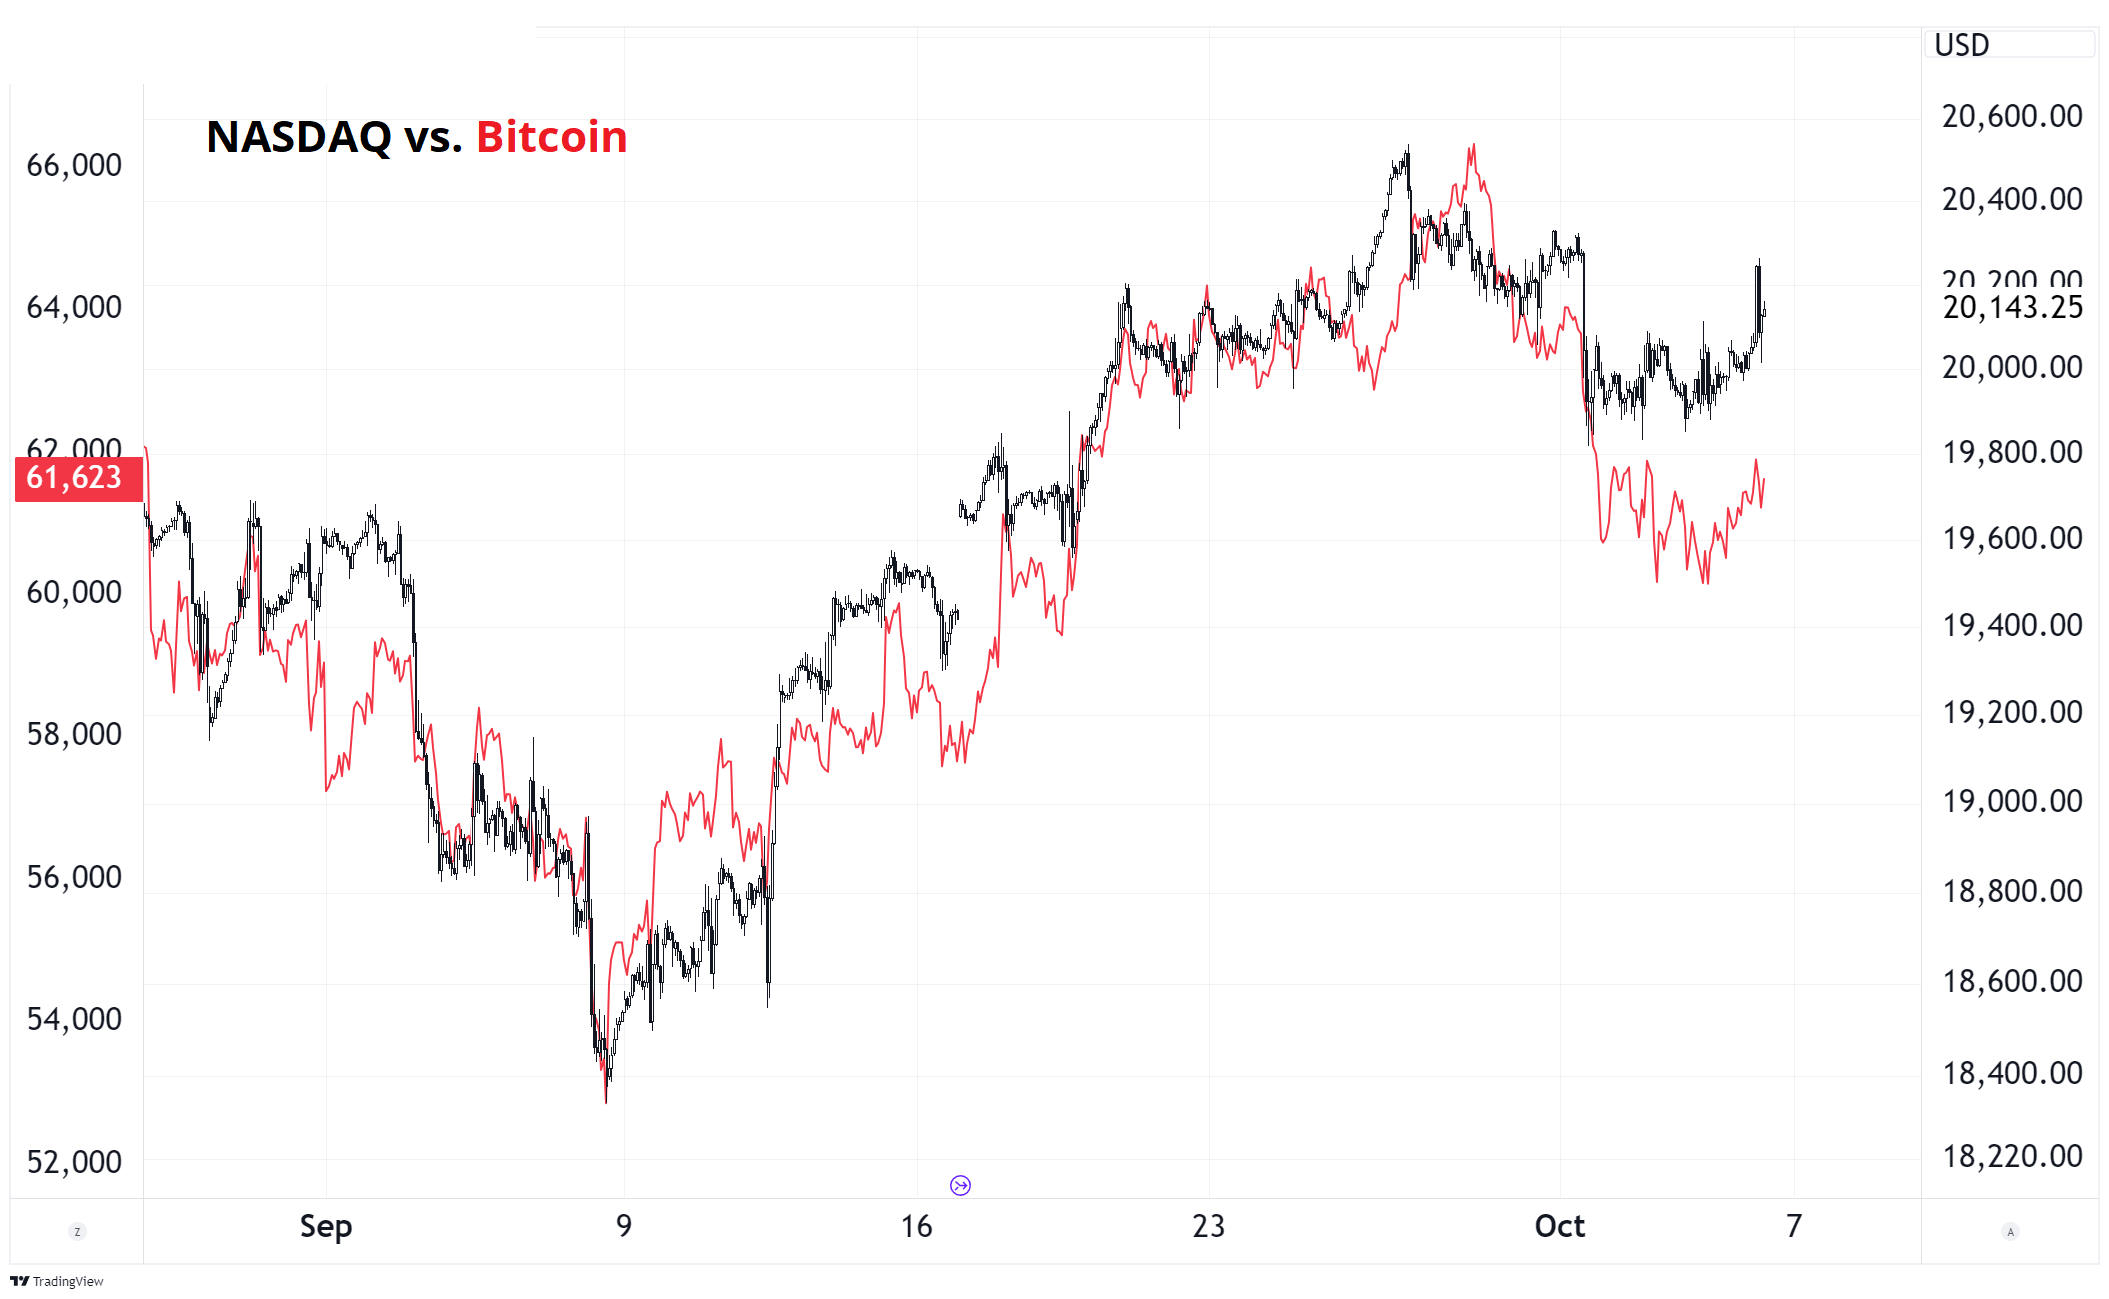
Nothing particularly exciting, though it has a bit more relevance going into Uptober as I’m sure many crypto traders were buying at the end of September in anticipation of seasonal tendies. Now, they are trapped a bit, long in the 64k/65k region and praying for a green candle.
But who cares about the price, when you have the intrigue of an HBO special coming out next week?! The makers of the documentary claim to have evidence proving the identity of Satoshi. You are right to be skeptical, as it feels a bit like the hype ahead of Geraldo’s big Al Capone reveal.

This story from Politico covers the Satoshi reveal story nicely, and includes this juicy tidbit:
Intriguingly, as the date for the airing of the documentary has drawn near, a number of high-value wallets from the “Satoshi era” have become active for the first time since 2009.
According to Bitcoin Magazine, around 250 bitcoins — worth approximately $15 million at Thursday’s bitcoin rate of $60,754 to the dollar — were drained from wallets in the past two weeks. While the coins are not officially linked to wallets used by Satoshi Nakamoto, they have been dormant since the earliest days of Bitcoin, when the cryptocurrency was worth almost nothing. The wallets’ creators would certainly have been Satoshi’s earliest collaborators.
Tune in Wednesday!
Copper is treading water this week as we wait for the China reopening.
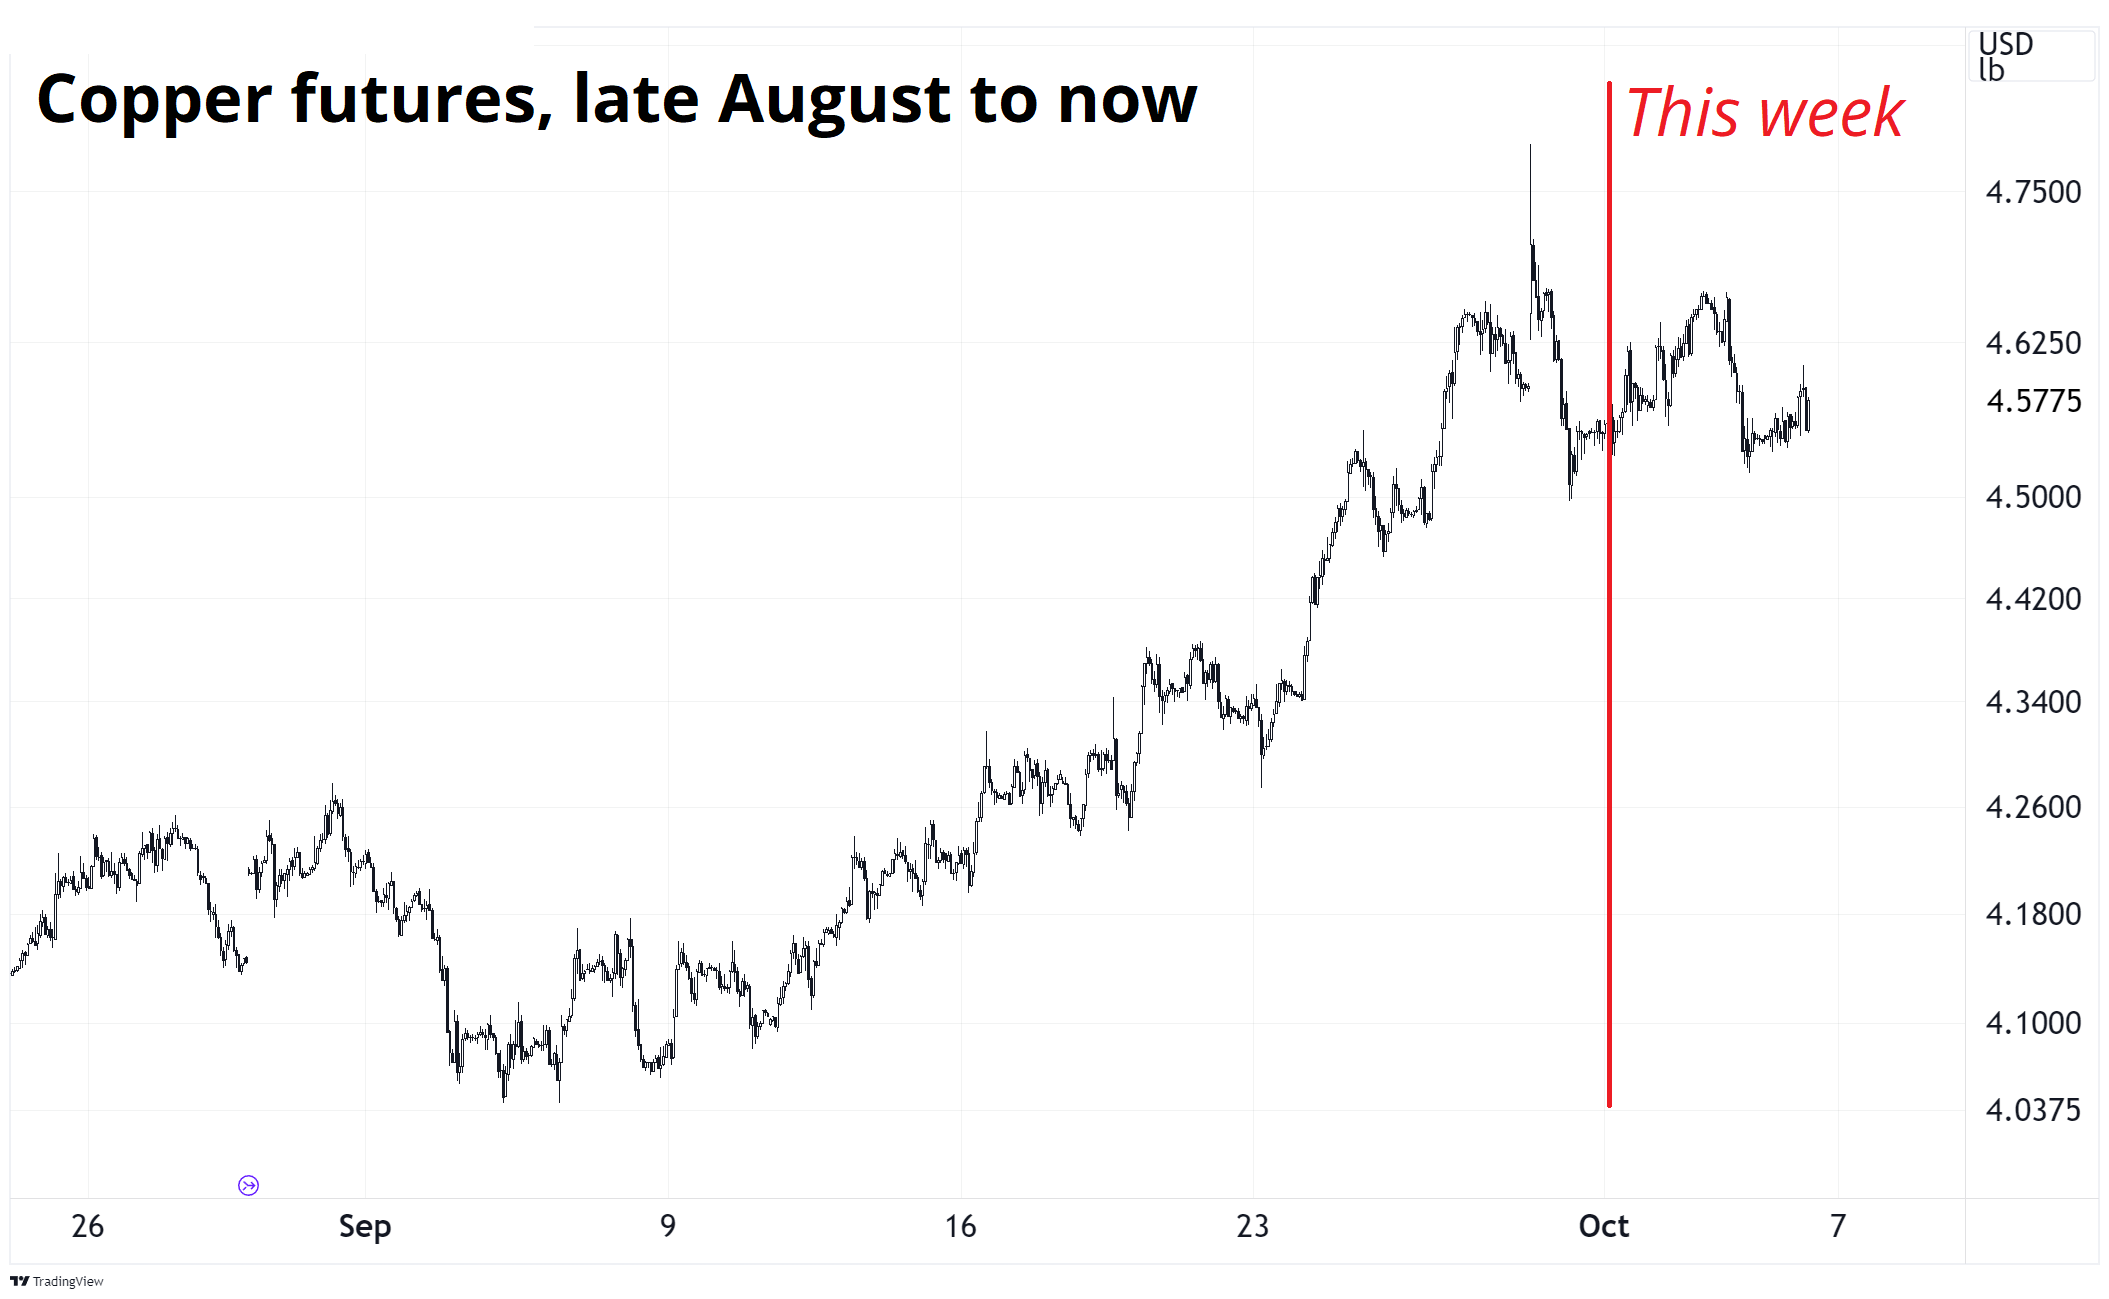
The big event next week is that China reopening on Tuesday (Monday night New York time). This is interesting because it’s not a typical event where it’s marked on the calendar and every market maker in the world knows about it, so the event is overpriced and vol doesn’t realize. Here, you have an event that is a bit under the radar as far as events go, and vols in FX and other asset classes now to 08OCT are probably underpriced in.
Price action when mainland China comes back is going to be lit.
Whew! OK! That was 9.214 minutes. Thanks for reading Friday Speedrun.
Get rich or have fun trying.
Smart, interesting, or funny
It’s nearly impossible to find good news in the mainstream media because their entire business model preys on negativity bias. But once in a while they accidentally print something optimistic.
Why is the speed of light so fast?
Full of learnings.
The perils of hyperoptimization
A short essay / long tweet that is erudite and reminiscent of persistent doubts about cost minimization and trinket maximization that is reminiscent of the book “Cheap” and Adbusters.
Music
The 4-hour documentary about the Tragically Hip is a must watch if you are Canadian, and a good one for anyone from anywhere who cares about music, art, and one human’s best attempts at being a good person. My four heroes as a boy and teenager were Terry Fox, Pete Rose, Axl Rose, and Gord Downie.
Gord Downie died October 17, 2017, and Pete Rose died this week. Sadness.
Thanks for reading the Friday Speedrun! Sign up for free to receive our global macro wrap-up every week.
It was a week of crosscurrents and contradiction

The risk reversal is a bit of a yellow flag in euro, even though I don’t want to believe it
