First, the arguments for a China deval are reasonable but not awesomely compelling to me. Second, as time goes by, the arguments for a relationship between US GDP and US stock prices become even less compelling.
Lifeguard tower in Miami Beach

First, the arguments for a China deval are reasonable but not awesomely compelling to me. Second, as time goes by, the arguments for a relationship between US GDP and US stock prices become even less compelling.

Lifeguard tower in Miami Beach
Short EURJPY @ 164.10
Stop loss 165.76
Take profit 160.16
There is quite a lot of excitement about a CNY devaluation out there as people view that there is a mismatch between the current level of CNY / CNH and the optimal level considering the economic / macro goals of the administration there. You can also argue that if they are thinking about a deval, might as well do it now and avoid risking a Trump presidency where any deval would be immediately countered by increased tariffs.
Andreas Steno Larsen outlined his arguments over the weekend, Bob Elliott also suggested a deval, and there was a lot of talk about this two weeks ago from commodities peeps.
While a deval could come at any time, and the persistent 2% gap between spot and the fix is intriguing… There are some gaps in these theories, I think. First, the gap has been persistent for ages. I talked about this on March 26th, in fact. In the chart in that piece, you can see that persistent 2% spot vs. fix gaps can preceded both a deval (like in 2015) or a rapid cratering of USDCNH (all the other times).
The argument that China is hoarding commodities ahead of a deval doesn’t make much sense to me.
First, as you can see in this chart, they didn’t do that last time.
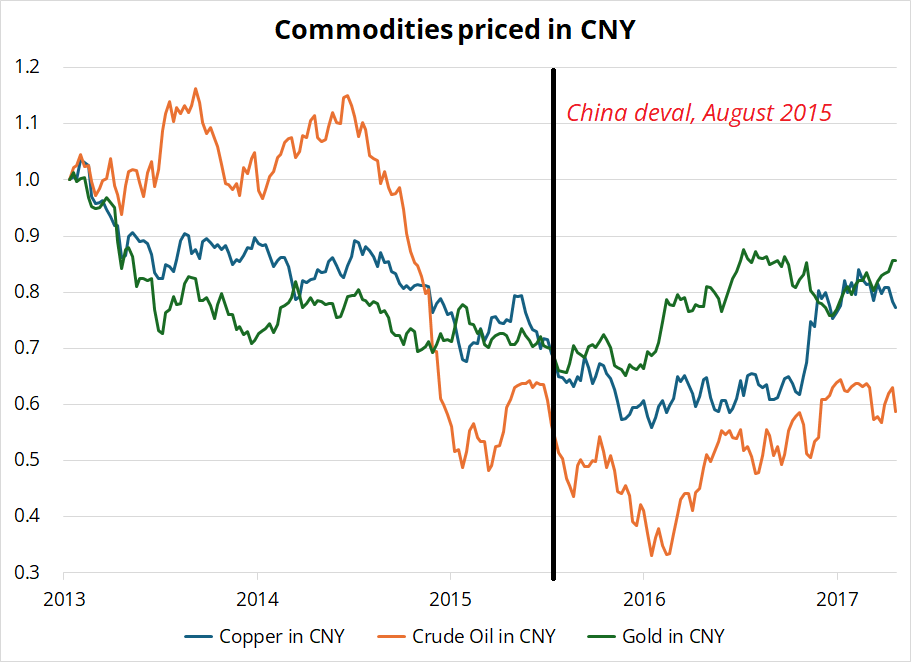
Second, commods went down after they devalued last time, both in USD and CNY terms. Oil dropped almost 50%, priced in CNY, and both copper and gold went modestly lower in CNY terms and didn’t go through the August 2015 levels for around 6 months.
Why would they hoard commodities ahead of an action that historically (and logically) will lead to lower commodity prices? Unless they are planning a devaluation that would dwarf the 2015 move, it doesn’t make a ton of sense and it is not consistent with what happened last time. Feels conspiratorial, like those recurring, but wrong, theories about a Shanghai Accord to weaken the USD.
A more logical strategy would be for China to devalue, then buy the inevitable dip in commodities. Not drive them higher before a deval, then watch as commodities dump. The theory that China could devalue is not crazy, or anything. There’s some decent logic in Andreas’ post. I’m just not sure I buy into much of the logic. That said, the longer the fixing and spot are exactly the maximum 2% apart, the more pressure builds on the currency. To be clear, I’m definitely not bearish USDCNH. I am just not moved by the deval arguments.
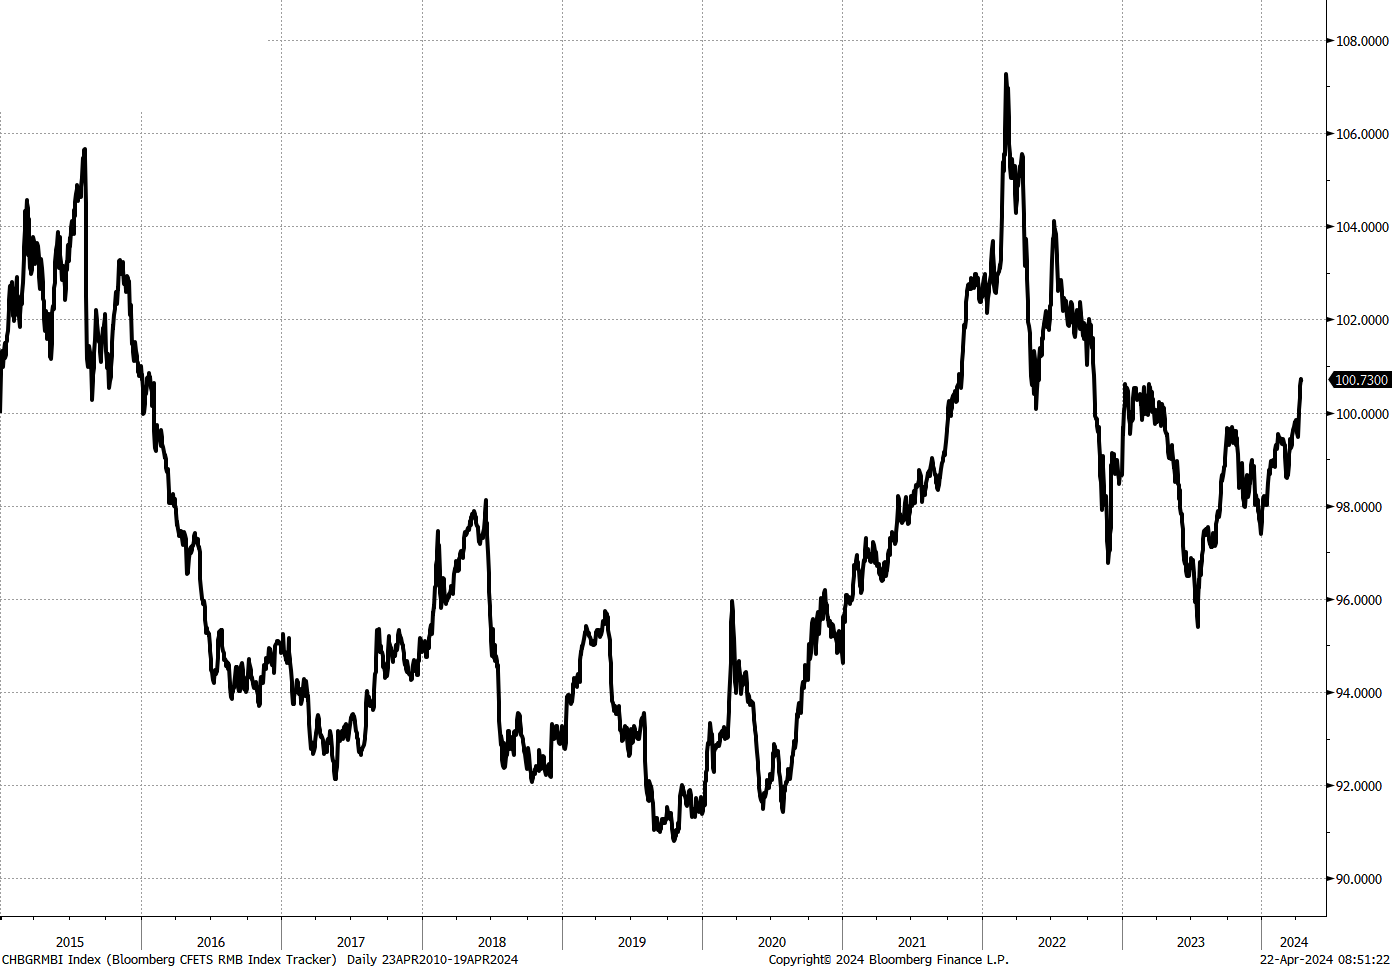
One last thing to think about. The currency is not nearly as strong as it was when they devalued in 2015 and it’s not nearly as strong as it was in 2022 when they won the battle. So, let’s see. Here’s the yuan vs. the basket, looking back to 2015.
The other theory I have been questioning for a long time relates to charts that show stocks vs. US GDP, suggesting a bubble in asset valuations. The charts tend to look something like this one from 2017.
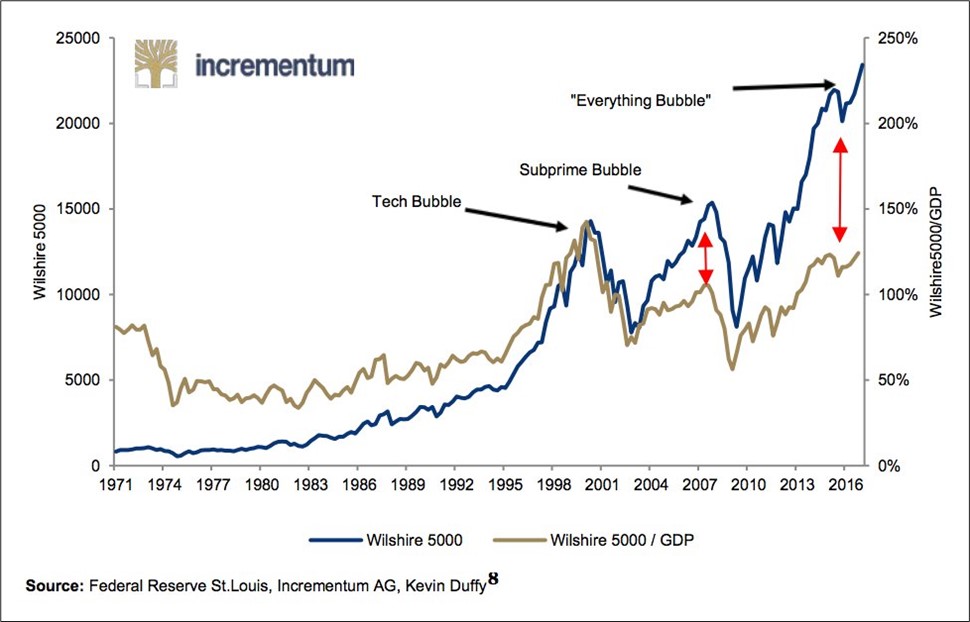
Charts like this are also used to show that fundamentals don’t matter, and QE has ruined markets, and indexing is ruining markets, etc. This section was inspired by this fantastic post from Kris Abdelmessih. There is so much useful information and so many thoughtful links in that post—I strongly recommend you take 30 minutes to go through it and some of the posts it references. The main chart Kris uses to show that fundamentals still matter is this one:
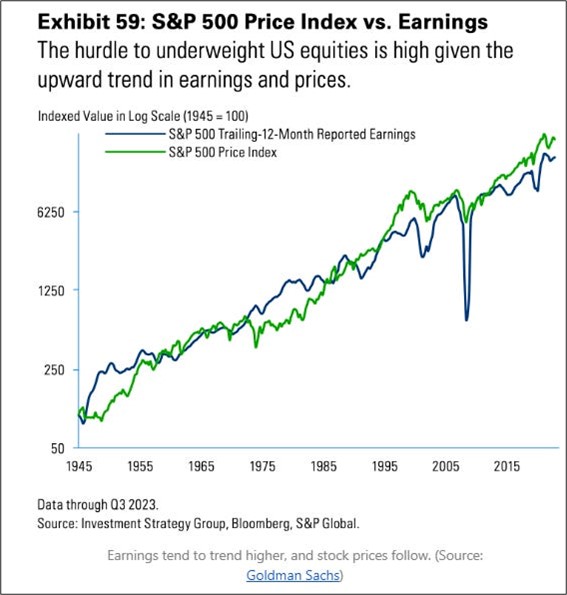
I wanted to broaden this out to see if it applies in a more granular way and also see if the US vs. Rest of World divergences are explained by such a simple framework.
It is getting harder to argue that QE created all these bullish distortions when a) every country did QE but only US stocks ripped to the moon and b) QT has been ongoing for a couple of years and none of these things reversed. If it was QE causing all this, wouldn’t you see the effect globally? And wouldn’t you see it unwind as QE unwinds? Hmm. The results are equally clear and stunning to me when you drill down.
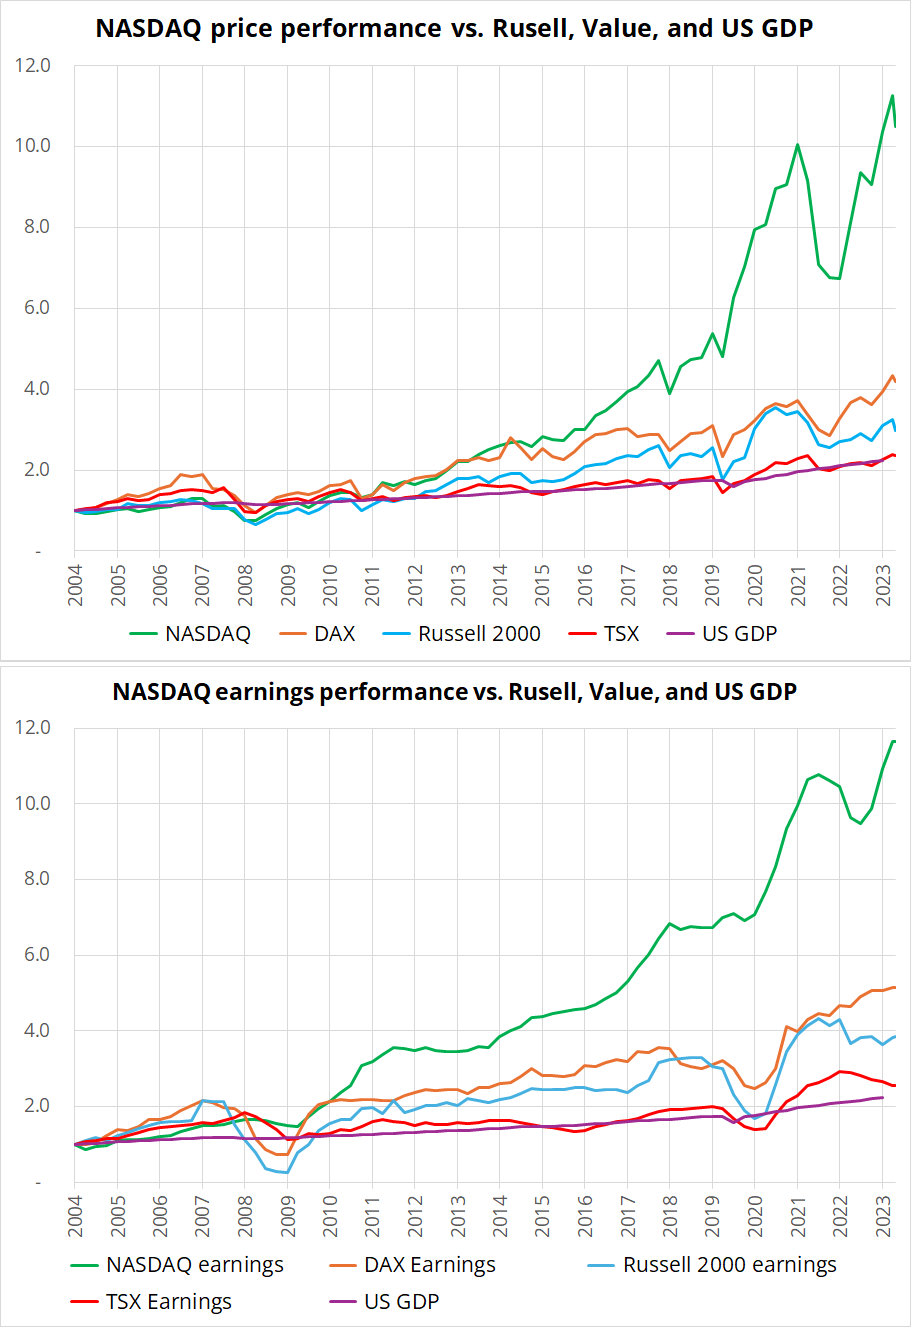
You can see that by direction, magnitude and ranking, earnings growth appears to explain the relationship between the performance of the NASDAQ, DAX, Russell 2000, and Toronto Stock Exchange. You can’t see QE and QT in there at all, really, unless you squint. The earnings vs. prices relationship is not perfect, but I would think at this point, with so much evidence of how stocks perform in various regimes, it stands to reason that a framework that predicts earnings growth is going to do better than one that predicts monetary policy or QE on/off. This is probably why geopolitics barely ever matters for stocks—it barely ever matters for earnings. Ultimately, it’s operating margins that matter, not GDP growth or Iranian drone attacks. Those things only matter to the extent they influence earnings.
Forecast earnings and you can forecast stocks. PS, I’m happy to hear arguments for why this is wrong. For a long time, I did think it was crazy that stocks were growing so much faster than GDP, so I’m open to the idea that I’m wrong here. But the evidence that earnings, not GDP, drives stock prices is compelling.
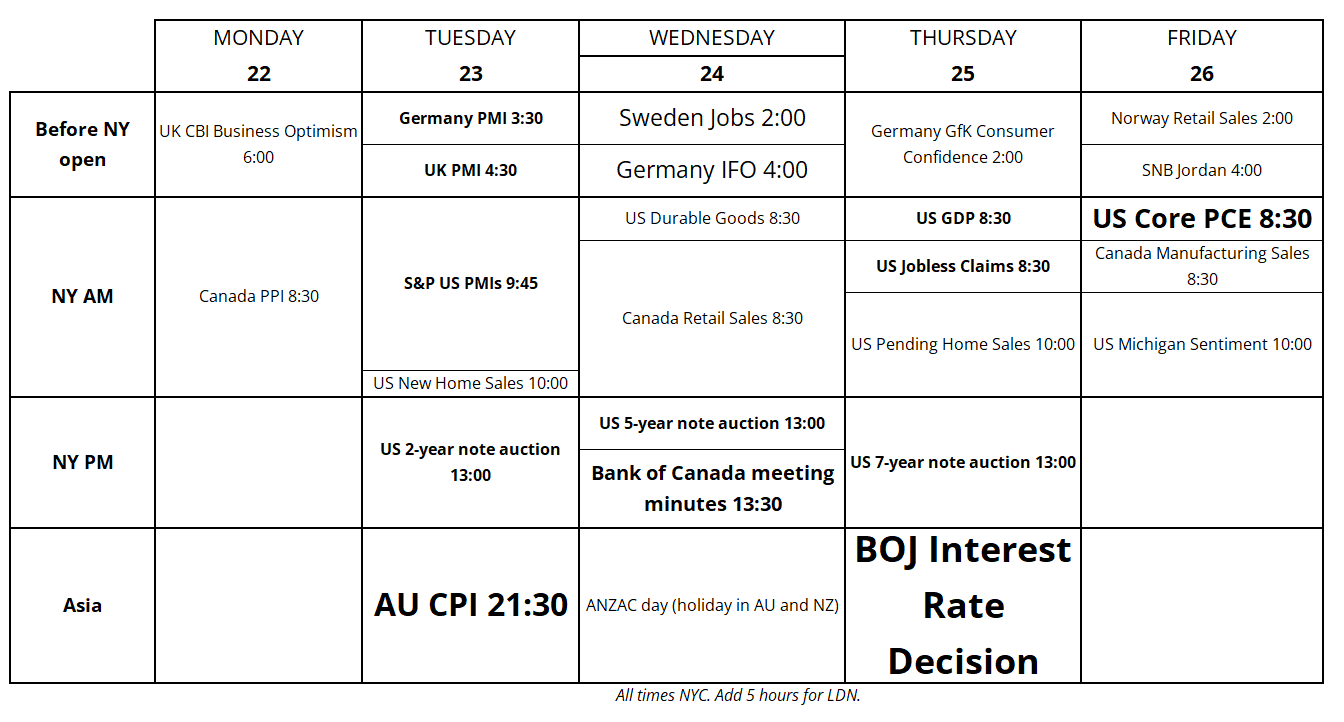
Aussie CPI and the BOJ meeting are the big ones this week.
Oil, yields, and Nikkei all point to lower cross/JPY. I hope that my patience is rewarded. And I wish I had been more patient on EURGBP.
In case you don’t follow women’s golf, this is a nice story of grit and persistence.
Have a sunny day.
I was in Miami for a wedding this weekend.
My wife took this picture and I like it.
