Today’s piece is about stocks, seasonality, BOJ tactics, and the US dollar.

The original Chupa Chups logo was designed by Salvador Dalí

Today’s piece is about stocks, seasonality, BOJ tactics, and the US dollar.

The original Chupa Chups logo was designed by Salvador Dalí
08AUG EURUSD
1.0970 put for ~32 pips
Target 1.0830 (spot ref 1.1045)
Short GBPUSD at 1.3080
Stop loss 1.3026 (was 1.3226)
Take profit 1.2757
Long USDCAD @ 1.3230
Stop loss 1.3088
July 27, 2023
Let’s open with a fun and scary chart. I don’t generally publish a ton of bearnip like this because I think one of the greatest leaks in finance is staying bearish too much of the time and because there is always going to be plenty of bear porn out there; if you want bearish charts, just go to Twitter and scroll for a few minutes. I’m making an exception in this case because I didn’t know what was going to pop out here, I just plugged the condition into my Excel sheet, and this is what I got:
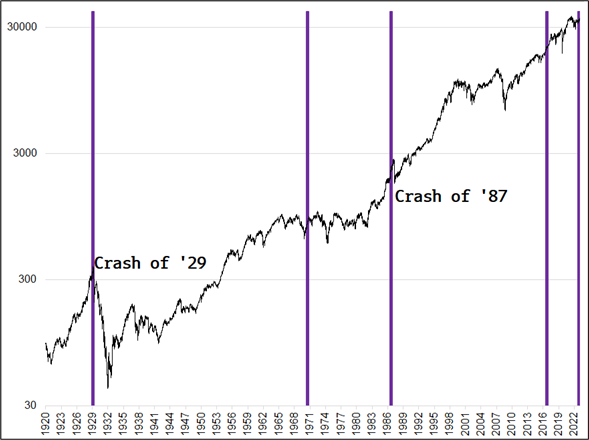
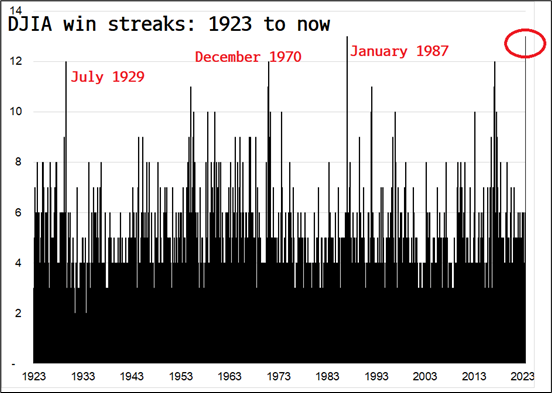
This stuff is not actionable. Imagine going short in early January 1987, knowing a crash was coming. You would have been stopped out, almost surely. This does give another example, though, of how we are in most unusual and potentially sketchy times for stonks. The VIX is signaling all clear while the outperformance of mega vs. equal-weighted QQQ (see yesterday’s piece), the explosion in volatility in MSFT, and the record streak in the DJIA all point to meaningful tail risk despite the ongoing bull market. Not to mention the resurgence of inflationary pressures.
An astute reader asked me: “Is the USD-positive seasonality in August just an artifact of weak equity markets in August?” It’s a good question because the USD vs. equities correlation is kind of unknown / negligible right now so if USD strength in August is just a product of equity weakness, maybe it’s not relevant this year. Here is the breakdown of August performance of USD and SPX over the last 31 years.
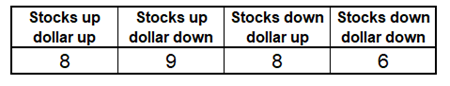
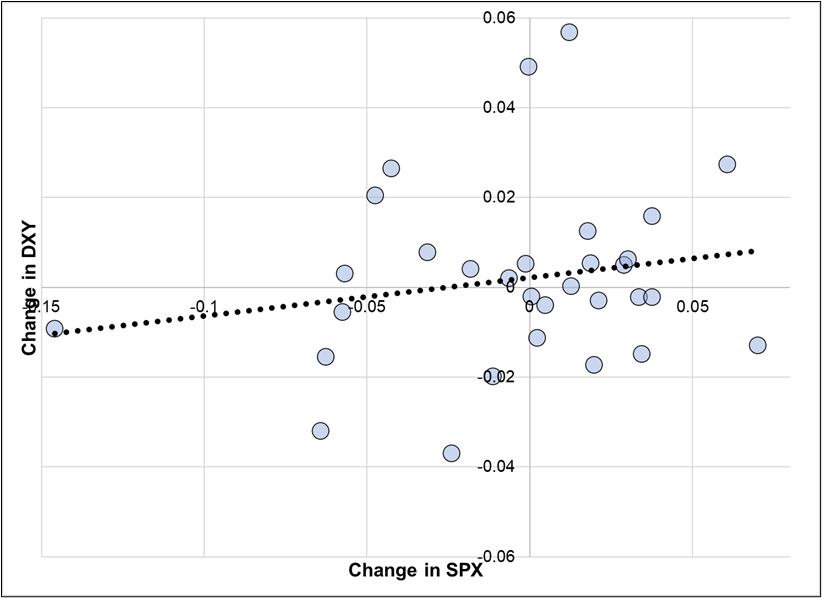
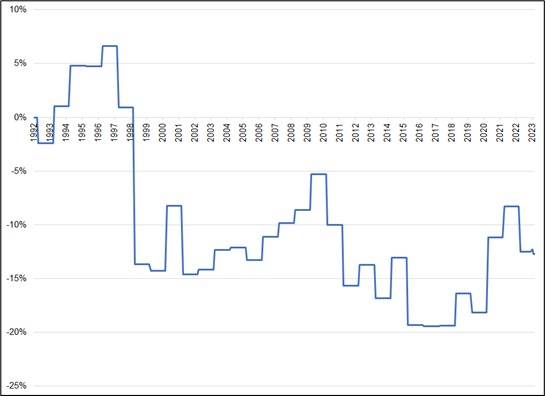
You can see that the dollar goes up equally whether stocks are up or down, so the USD strength is more about average performance of the USD in August (up a lot, or down a bit), not equity weakness. Here is a scatter of DXY and SPX performance for August since 1992.
How weak are equities in August? The average August return is -0.4% but the median is +0.2%. In the context of a raging bull market since 1992, that is quite weak. September is weaker, FYI. Here is a chart of August performance. You can see that the average is skewed by a huge 15% drop in August 1998, and we’ve been flat in August since then. Flat in August is incredibly weak for an asset that went from 415 in 1992 to 4627 today!
Very, very rarely, there are moments when it feels completely stupid to have a particular view. I remember feeling that way only a few times, most recently in December 2022, when I was bullish stocks:
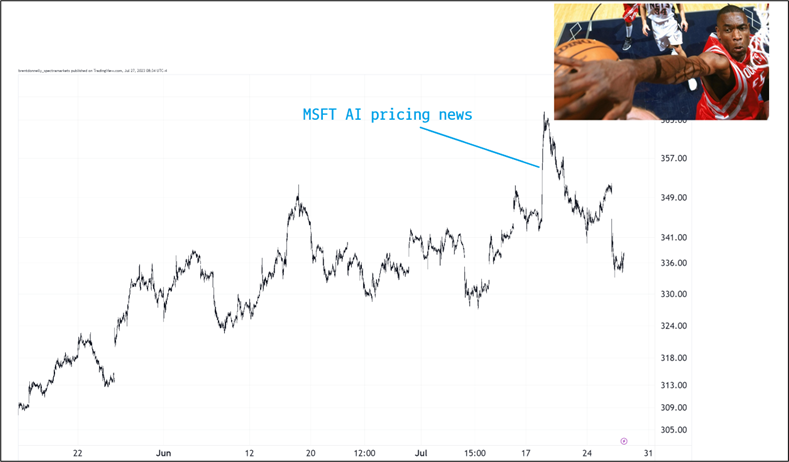
Bearish stocks feels stupid right now. The rally has been so relentless and so much cash has been burned on bearish views that it feels silly to be bearish here. But with the AI echo bubble, strange behavior under the hood, megacap record outperformance (see yesterday’s am/FX chart), MSFT wildly volatile, Dow up 13 days in a row, bearish seasonality in August and September, and inflationary pressure increasing again… Maybe this isn’t the worst time to take a bearish shot. It is also notable that MSFT has tanked a bit post-earnings, suggesting perhaps we finally reached a point where the AI bubblette is priced for perfection.
As a 6-month play, I like the short QQQ vs. long QQQE trade from yesterday or something like:
Sell December 2023 MSFT 350/370 call spread and buy a December 2023 305 MSFT put. You should get roughly $7.50 for the call spread and pay similar for the put. Pricing is ballpark and this is not investment advice. Max loss $20 per contract.
To be clear, I know it feels ridiculous to be bearish stocks, but I’m bearish stocks.
Bullish dollars is tiring. I’m encouraged by today’s US data as it furthers the idea that we can just slowly price in a September Fed hike as there is no reason for the Fed to chill out as inflationary pressures have turned quite aggressively despite lagging official data signaling rampant disinflation. Higher oil, higher commodities, strong housing, strong jobs market, fiscal largesse… Loose fiscal / tight monetary in the USA makes for a potent cocktail if the rebalancers take their foot of the dollar’s neck. The first week of August will be key for me as bullish USD seasonality kicks in and I will have to throw in the towel if the USD isn’t a fair bit stronger by, say, August 7 or so. That’s my reassessment point if I’m not stopped out first.
Dovish ECB and data dependent Fed with strong US data and PBoC done pushing around the USD is all encouraging for the dollar bull view.
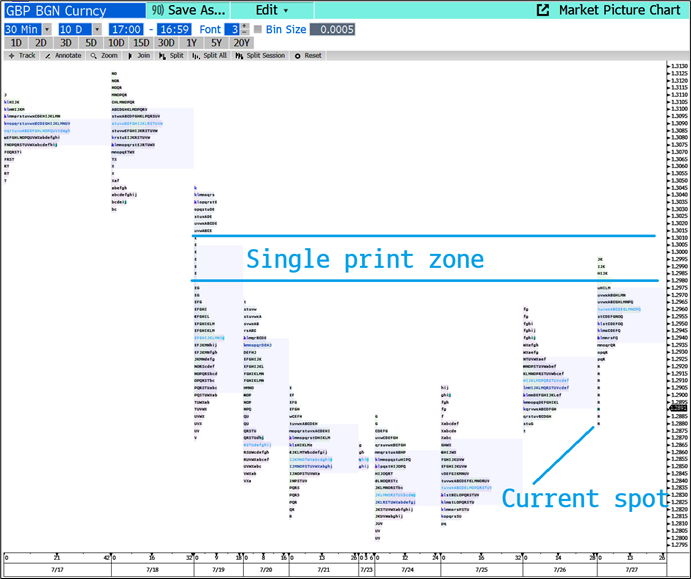
Also encouraging is that GBPUSD failed exactly where it was supposed to. Recall a few days ago I had emphasized the multiple convergence of levels 1.2980/00 and we went to 1.2996 last night. Perfect rejection of resistance indicates down trend is in force. Here is the market profile chart:
The final major event of the week is BOJ tonight. I don’t have a strong view on whether they change policy; it feels like a coin toss to me. I think the high EV play is to buy USDJPY on no change, even if you have to pay up through a 50-point gap. With strong US data continuing, a September hike likely to get more and more priced in, and the next BOJ meeting not until late September, an on-hold BOJ should reignite the carry trade in USDJPY.
Are you ready for the superconductor bubble? ASMC likes the news.
PRO: https://www.independent.co.uk/tech/superconductor-breakthrough-electricity-power-paper-b2382711.html
CON: https://www.spectator.co.uk/article/why-im-sceptical-about-a-superconductor-breakthrough/
Have a surreally-sweet day.
Salvador Dalí-designed logo (1969)

Current logo as of 1988
