Checking in on the month-end models and some other topics
More detail and larger image at end of am/FX

Checking in on the month-end models and some other topics

More detail and larger image at end of am/FX
Long GCQ6 at 4610
Stop loss 4294 Take profit 5320
Once upon a time, trading month-end was an incredible source of alpha. Many spot desks that I worked on showed three standard deviation outperformance on the last day of the month because client volumes are almost always highest that day, and the directional moves were extremely predictable. After COVID, that all changed as the systematic benchmark-hugging nature of the flows changed and became more discretionary. I wrote about this here:
https://www.spectramarkets.com/amfx/rip-month-end-models/
It is still worthwhile to check in now and then to see what is going on, and so I decided to do so today. A simple run of the xls shows that, despite the fact there was industrial-strength GBPUSD buying last month (for example), the overall performance of the USD on both corporate and real money month end has become unpredictable. EMH, which was kinda sorta violated for years, has returned.
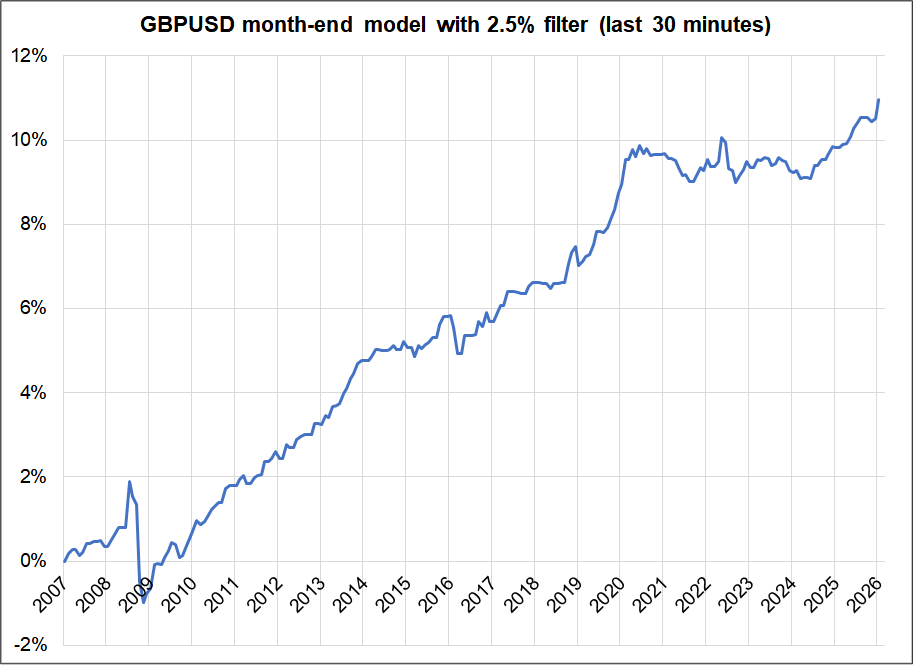
My first chart today shows the P&L of trading GBPUSD according to the standard month-end model. Filter for a 2.5% or larger monthly move in stocks and if stocks up, buy GBPUSD, if stocks down, sell. There are more sophisticated month-end models, but they all converge on the same signals and multivariate models don’t backtest any better than the single variable one.
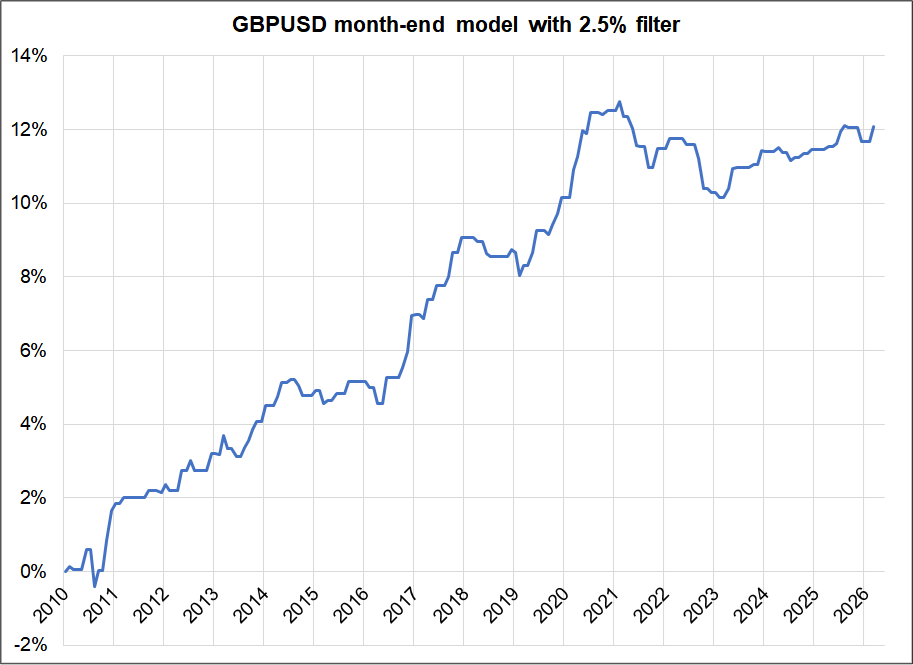
Easy to see how the model stopped working after COVID as real money changed their behavior. This next chart shows the P&L of three strategies, again in GBP. Due to the enormous UK pension fund holdings of U.S. equities relative to liquidity in GBPUSD, cable used to backtest the best. The three strategies are:
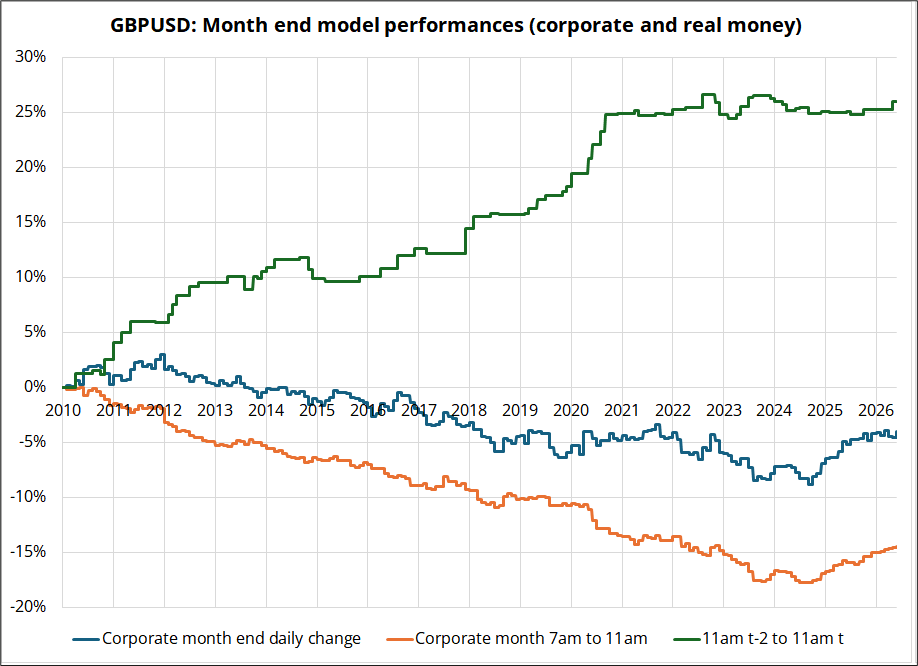
You can see from the orange line that the very reliable trade (GBPUSD lower on corporate month end) also stopped working in mid-2024. These month end effects have simply become too well-known and so the speculators front running the flows and the executors of the flows have changed behavior so much that the effects are gone. It’s still worth being on guard for huge, random flows in the logical direction of the month-end predictions, but the aggregate effect of these flows can no longer be seen in the data.
I won’t bother putting the EURUSD chart as it looks nearly identical but let me share the USDJPY one so you can see that corporate month end has also lost relevance.
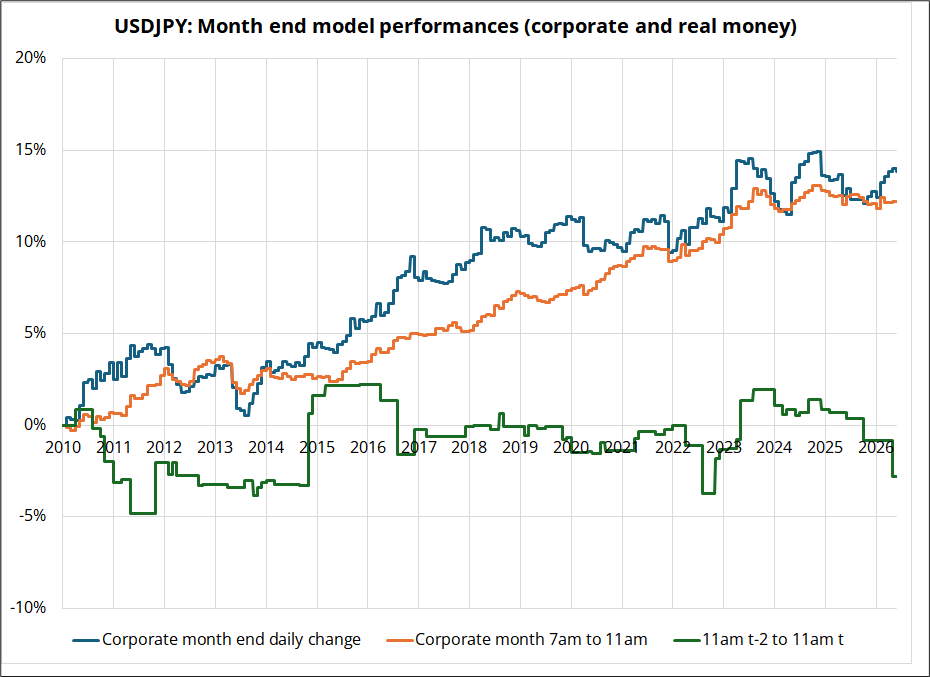
There is still some tiny effect to be seen if you zoom in and only look at 10:30 a.m. to 11:00 a.m. That window is still influenced by the systematic benchmark huggers.
And here’s AUDUSD and USDJPY. Note that USDJPY is always the other way because JPY hedging behavior is completely different from USD hedging behavior.
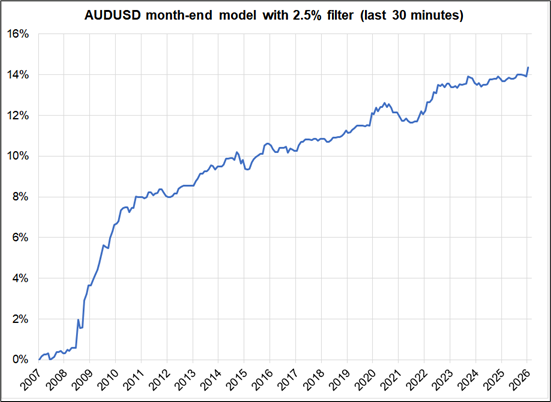
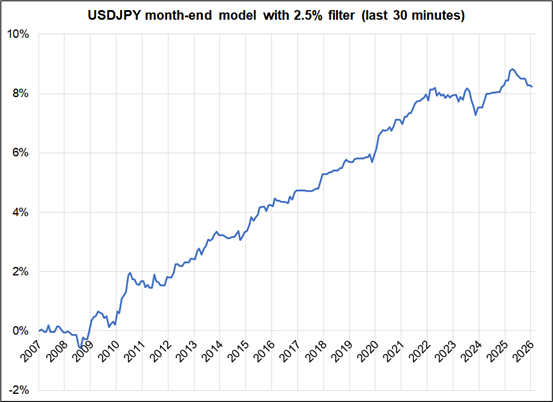
There is still marginal value in understanding month end because let’s say you are bearish AUDUSD and it’s the last day of the month and stocks are up 6% that month. You are better off selling at 11:00 a.m., not 10:30 a.m., obviously. You can also still use any random and extreme moves at month end to put on larger trades the other way. Liquidity at month end is almost bottomless if you are going the opposite way of the flows.
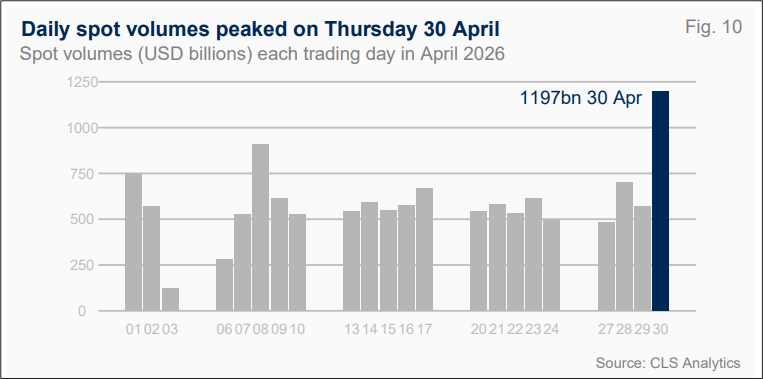
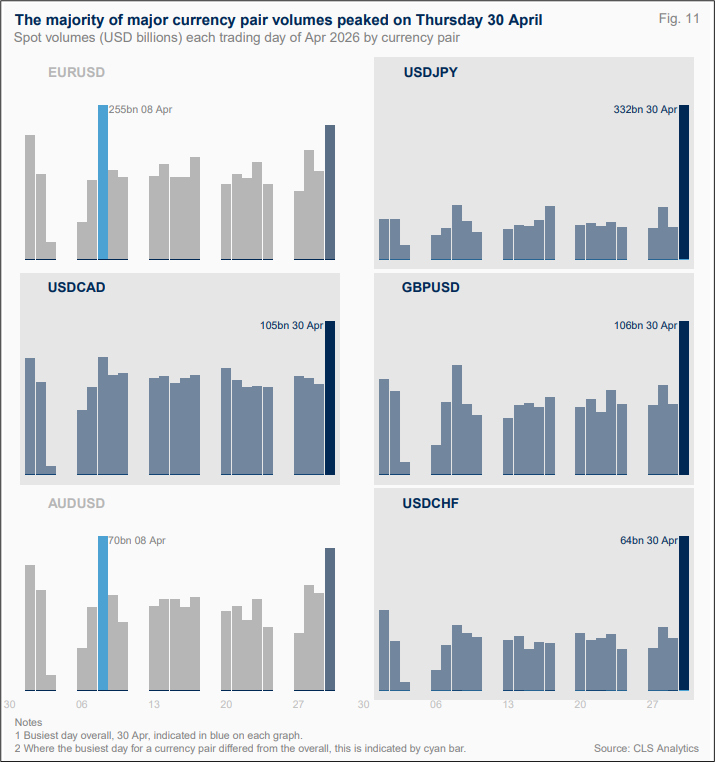
To give you a sense of how large month-end flows are relative to rest of month, here are two charts courtesy of CLS.
Speaking of things that have changed since COVID… Economists persistently overestimated inflation for years as you can see from the cumulative miss of Core PCE (actual release, unrevised) vs. survey.
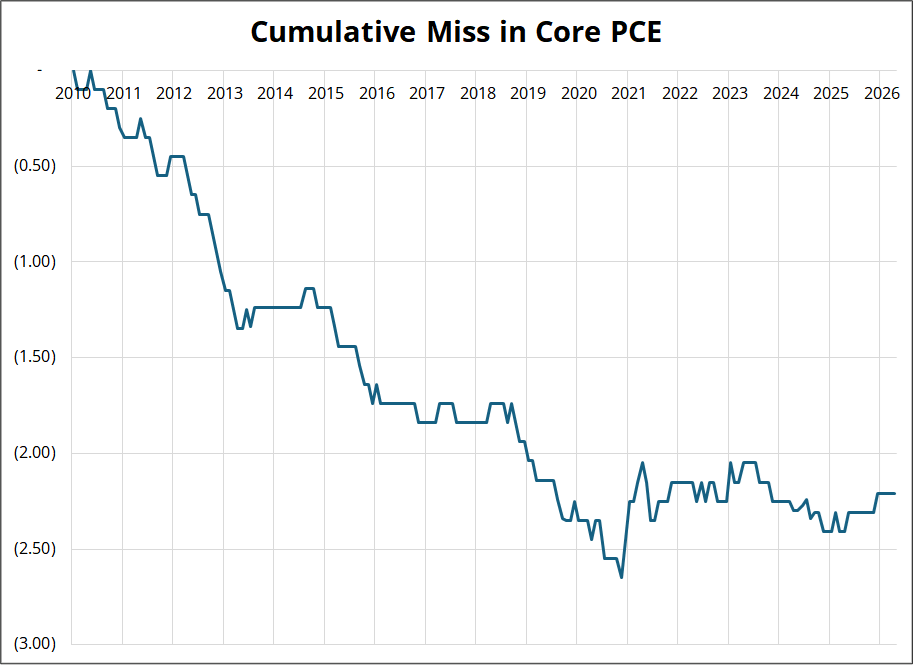
My guess is that a supply shock from AI Capex (higher costs for computers, memory, etc.) plus a war shock plus skyrocketing financial markets means that the risks for Core PCE on Thursday are to the upside.
Economists tend to anchor on prior data and models don’t work well in regime shifts and so my guess is that 0.4% is much more likely than 0.2%. 50 out of 58 economists predict 0.3%.

Crypto and gold are not trading well at all. It is a strange and a concerning divergence from the riskiest assets (DRAM, ASTS, etc.) The space and memory bubblettes are in their own galaxy. The momentum factor is doing too much work now. My guess is that pain is coming soon and I am gingerly attempting some shorts in the bubbliest stuff like DRAM and ASTS. I am not putting it in the sidebar because I am too likely to change my mind on a dime and because I am too scared.
The Nationals are two games above .500 (!)
Enjoy your day.