
Before we get started…
Get the tools and practical frameworks you need to understand markets in the real world. Course info, syllabus, and FAQ on the website.
Check out the video for a quick run-through. The course is perfect for traders, sell-side analysts, wealth managers, RIAs, finance students, econ grads, central bankers, and anyone outside finance who want to learn how markets operate in the real world. www.spectramarkets.com/school
Global Macro
First of all, your monthly reminder that there is a lot of noise in headline nonfarm payrolls and even more noise in the Household Survey.

Anyway. Sometimes you see the world clearly and sometimes it’s a mess. I have felt that things were looking clear since late April as there was good evidence of slowing demand from US consumers in the official and corporate earnings and earnings calls. Disinflation appeared to be upon us. Goods prices were flat or deflating and commodities were sucking wind.
Now, I’m not so sure. The main reason I am not as confident on the disinflation theme for now is wages. It is possible that wages are a lagging indicator, and it’s possible that services inflation and wages both remaining stuck is a sign that we are not normalizing back to pre-COVID anytime soon.
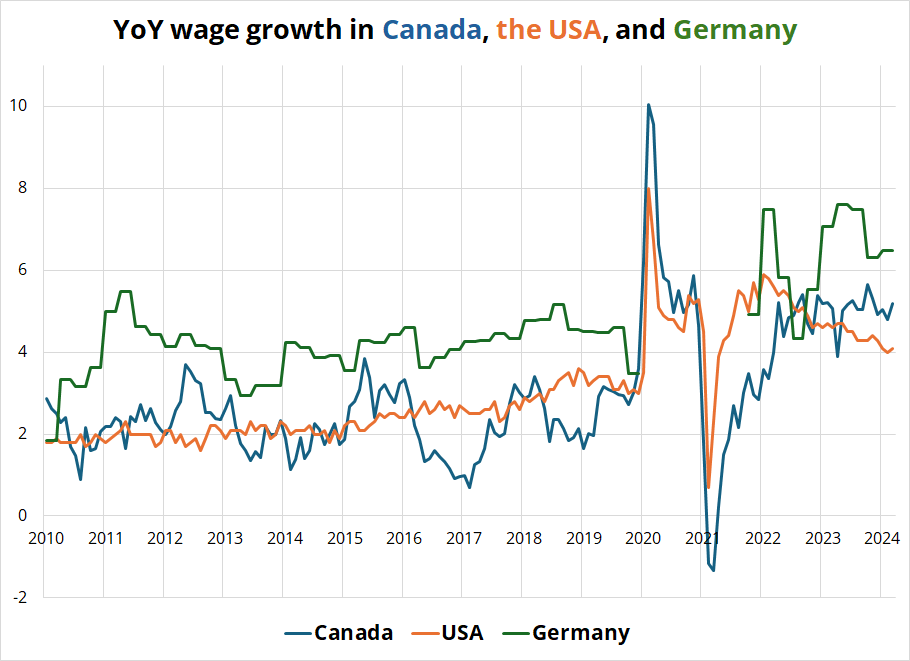
Chart by Aadit Rajangam
When I am looking for themes and trades and making decisions… I want many planets in line and many more pros than cons. Currently, things look roughly like this:
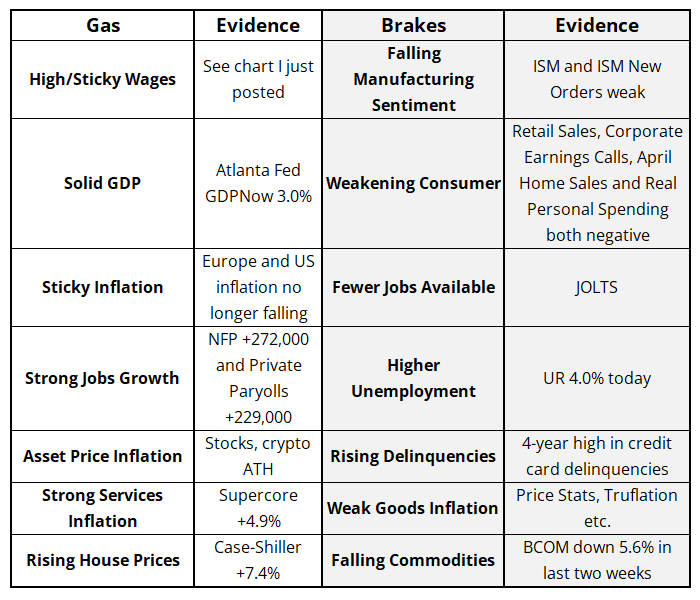
There is no clear theme or narrative here. Inflation is sticky, wage growth is good, jobs markets are cooling but still hot, and so on. I often tell people that it’s OK to have no view or no opinion on something. You don’t always have to be bullish or bearish on the economy or long or short NVDA. You can say – this is too hard. I don’t know. Je ne sais pas.
Or as my Latin friends say: Nescio.
My confidence in the disinflationary narrative I was seeing for the past six weeks has fizzled and I am going to just be agnostic for a bit. Let’s see what happens.
I would be remiss if I didn’t mention that the Bank of Canada and the ECB cut rates this week. They don’t seem to care about 5% wage growth as they are uber-confident in their forecasts.
As ECB President Christine Lagarde put it:
The other key factor in the Governing Council’s decision-making was the “reliability and strength” of ECB staff projections, Lagarde said, noting there had been little variation in the bank’s fourth-quarter 2025 inflation forecast since September.
“It is on the basis of this reliability and solidity and robustness of those projections that we have made that decision to actually cut,” she said.
If you have been in markets for more than five years, you know why this is funny. I am a big believer in the idea that humans are really, really bad at forecasting. You don’t even have to believe in it, because it’s not a theory. It’s been proven over and over and over.
It looked like the central banks were learning this (finally!) as the Bernanke review and the ECB mea culpas showed some forecasting humility finally. But NOPE! Lagarde could not help herself. Here is some context.

Straight from the “You Can’t Make This Shit Up!” department.
So the ECB precommitted too early to a June 6 cut (mistake one) then claimed supreme forecasting skills to justify it (mistake two). Whether the cut is the right or wrong strat—the communications are clowney.
Stocks
Did you hear there’s this guy named Keith and people worship him like a God and he posted an Uno card and got drunk and high and did a livestream and was worth just short of a billion dollars at one point last night? Yeah. It’s true.
Roaring Kitty needed to sell his entire GME position at $69 to become a billionaire (proof of simulation #7732) and it traded up to $67.76 last night before opening at $38 today.
Here’s the chart:

The livestream was cringe enough, but it’s even more hilarious that GME rug-pulled the Kitty by releasing earnings four days early this morning and dropping a secondary like an anvil on the craniums of his admiring acolytes. Each one of these impulses will certainly have diminishing returns as you can fool them once and shame on you but fool them twice and… Won’t get fooled again. As they say in Tennessee or something.
There is not much fun or counterculture or “stick it to the man” aspect to the Roaring Kitty and GME story anymore. It’s just a sad lotto ticket / FOMO party now, with fools looking to monetize greater fools and other fools (like me) watching a pointless livestream.
The stock market overall continues to fly, fly away with all major indices making new all-time highs again as skepticism reigns and underweights drown.
Bitcoin fans love to talk about the slowly-rising supply of bitcorn, but the reality is that megacap stock supply is actually declining. So the supply argument makes megacap the play, not bitcoin. Here’s a chart of aggregate supply of S&P shares:

And here’s Apple:

I think it’s useful to remember that megacap tech and bitcoin are basically the same trade for now and for the past several years.
That said we are at or near maximum nonsense… We now have NVO on South Park, the GME cringefest, and the Signing of the Boob. One year from now, we will look back and remember it all with fondness as we stare at NQ futures trading sub-16000.
Here is this week’s 14-word stock market summary:
The Kitty Roared but the market will get bored. Jensen Huang signed a boob.
Interest Rates
The brakes dominated most of the week but then NFP hit the gas, so you end up with a chart that looks like this:
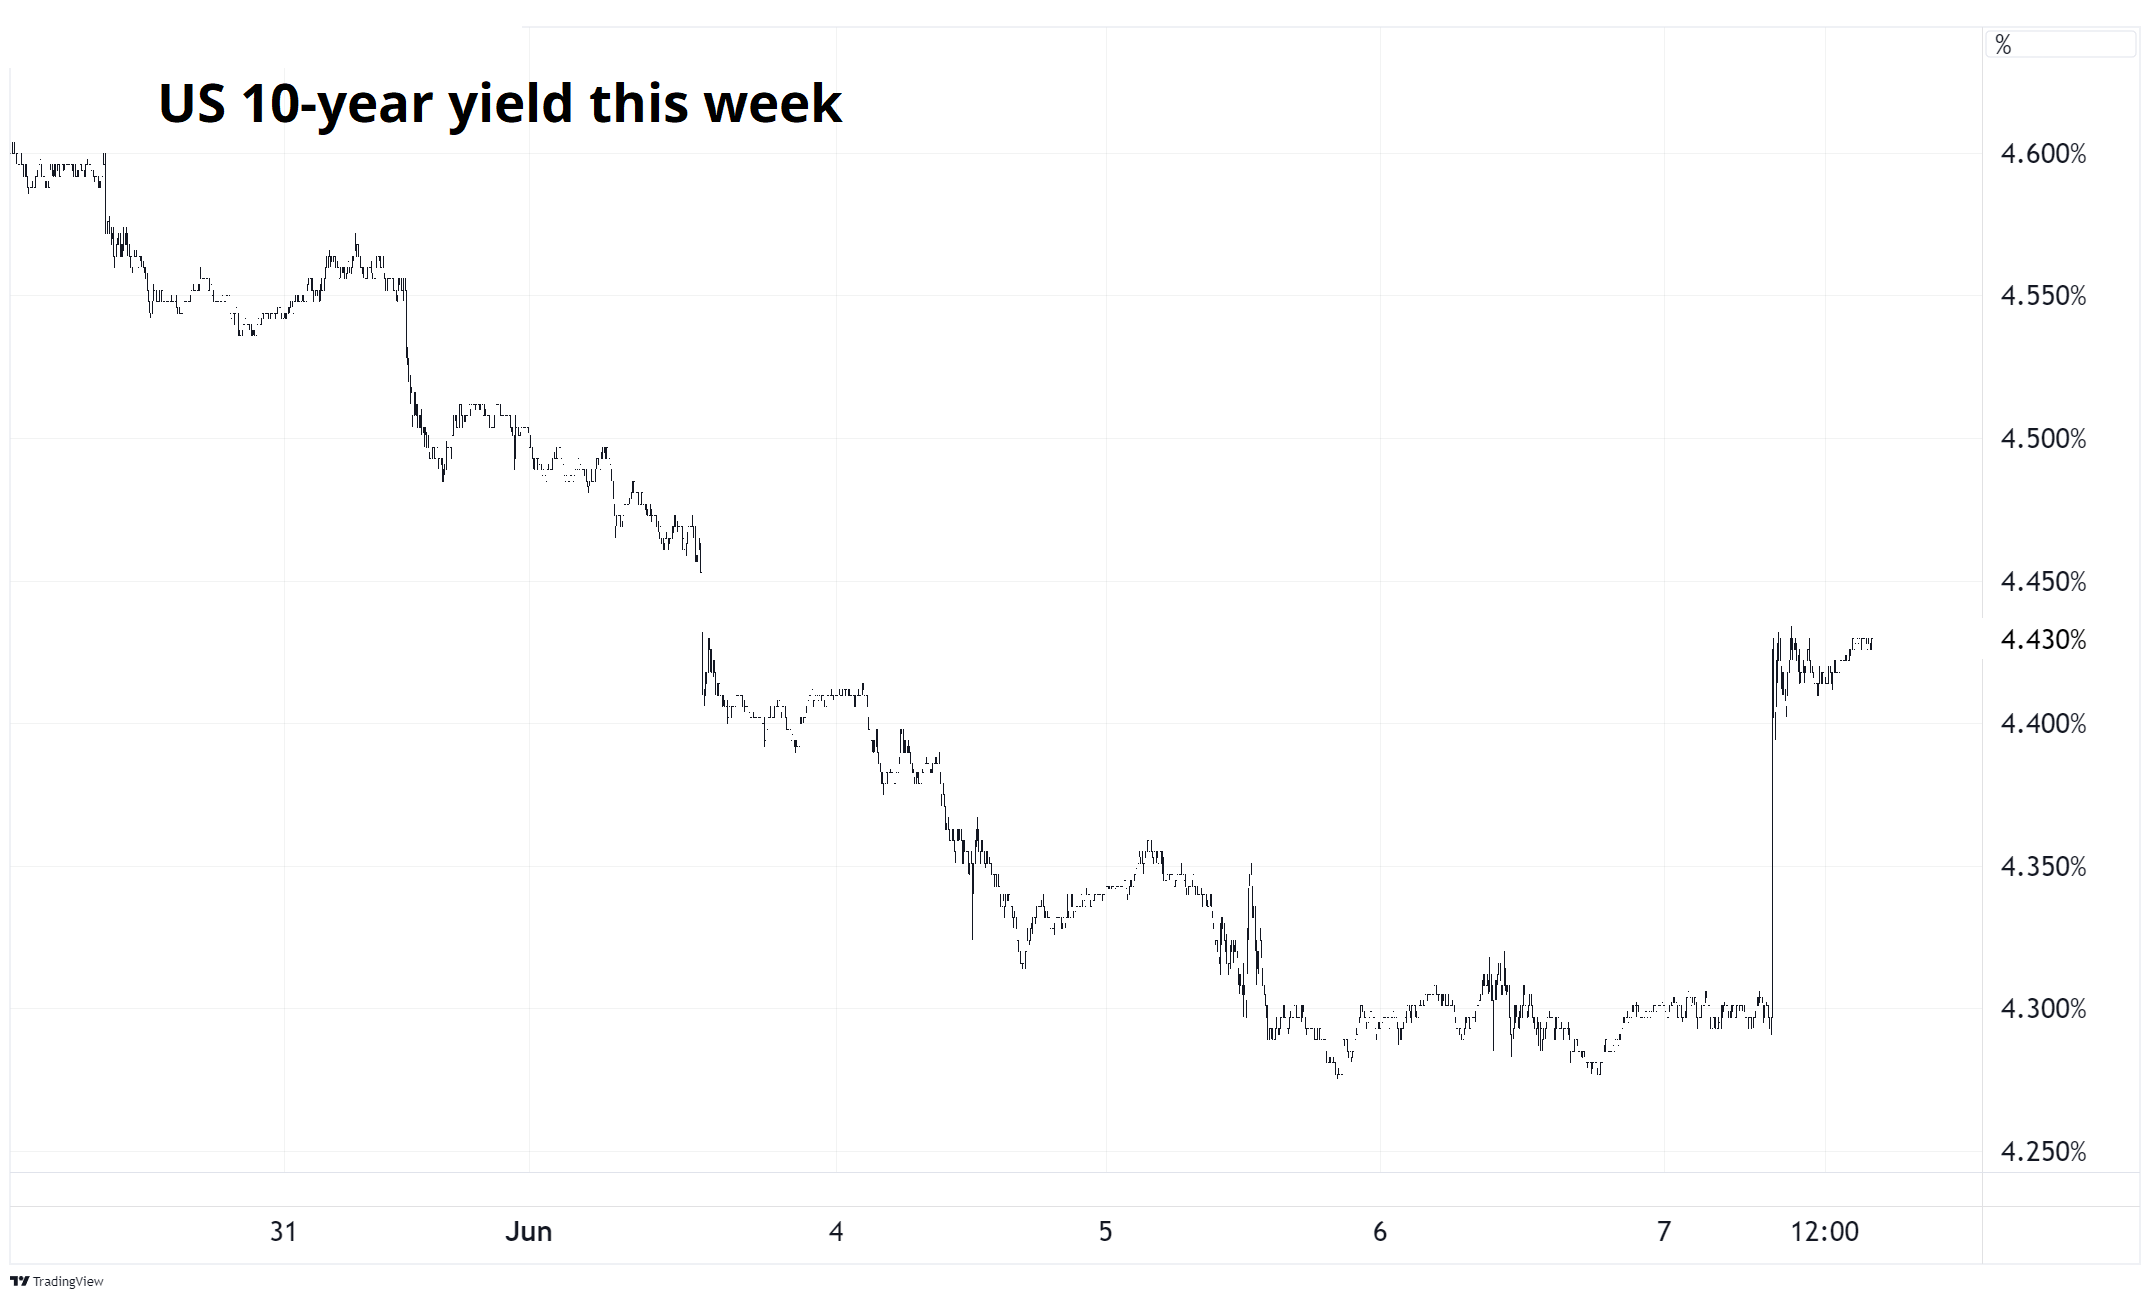
It’s not obvious or even at all apparent to me where we go from here. The crosswinds are plentiful and the data will determine the next 20bps in 10s. We get US CPI next week, along with FOMC, so Wednesday is the big day.
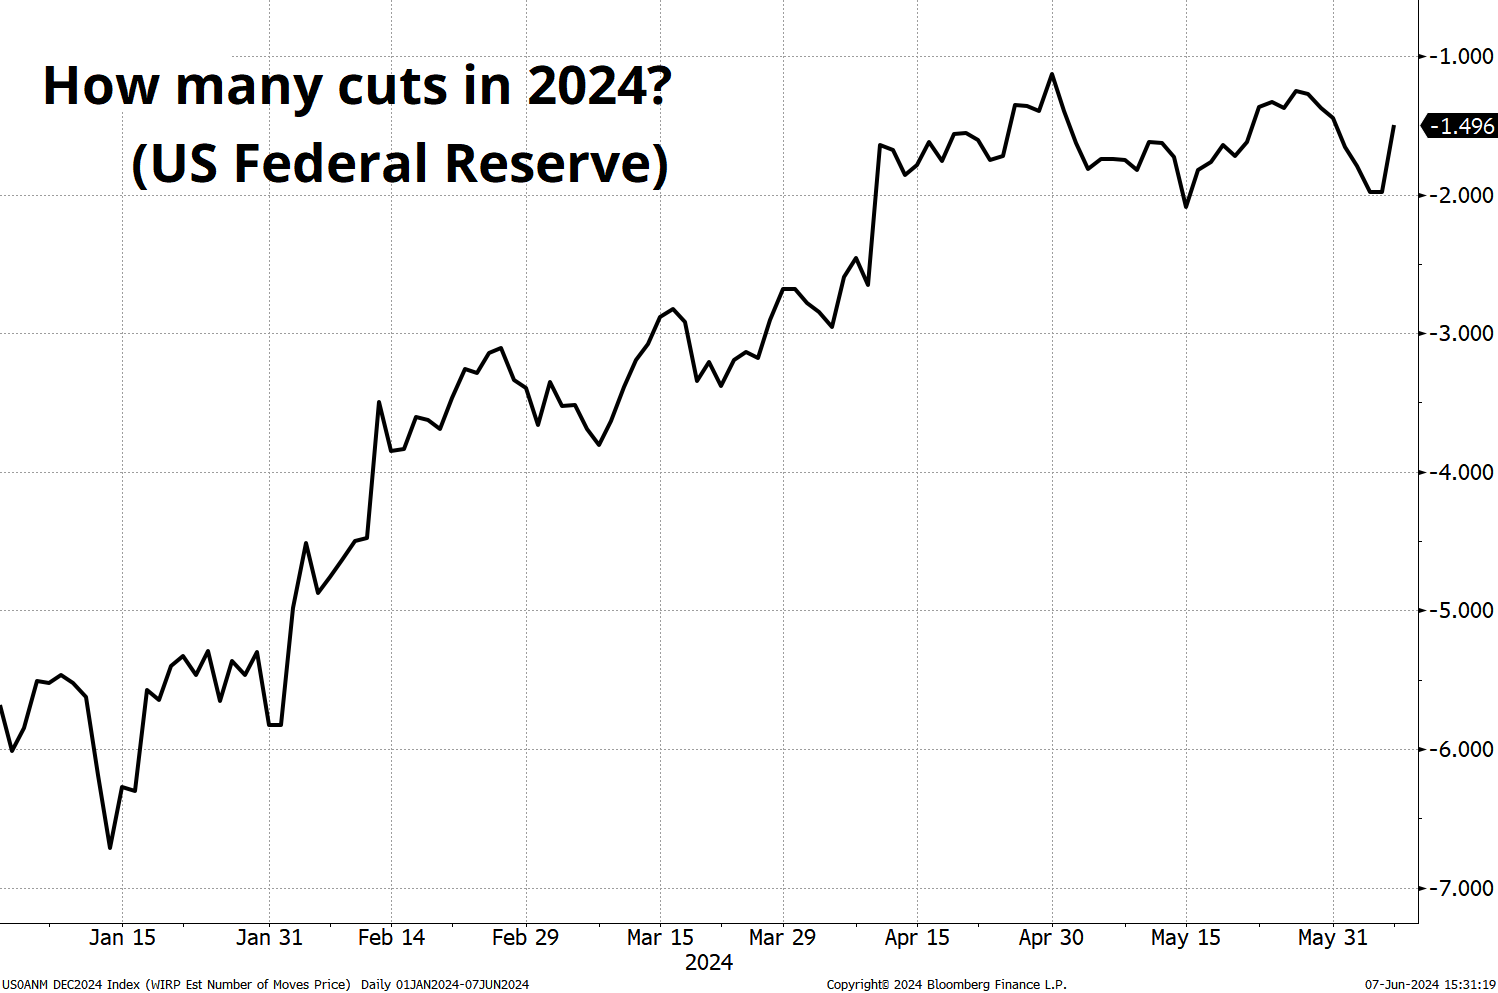
The market tried to price in more Fed cuts, and we got to two for the remainder of 2024, but now we’ve bounced hard and the modal forecast is back to around zero cuts with 1.4 cuts as the average.
Fiat Currencies
Mexico has been the poster child for the carry fest that has been ongoing in FX markets over the past 18 months. This week, the steamroller finally showed up to run over all the nickel-picker-uppers.
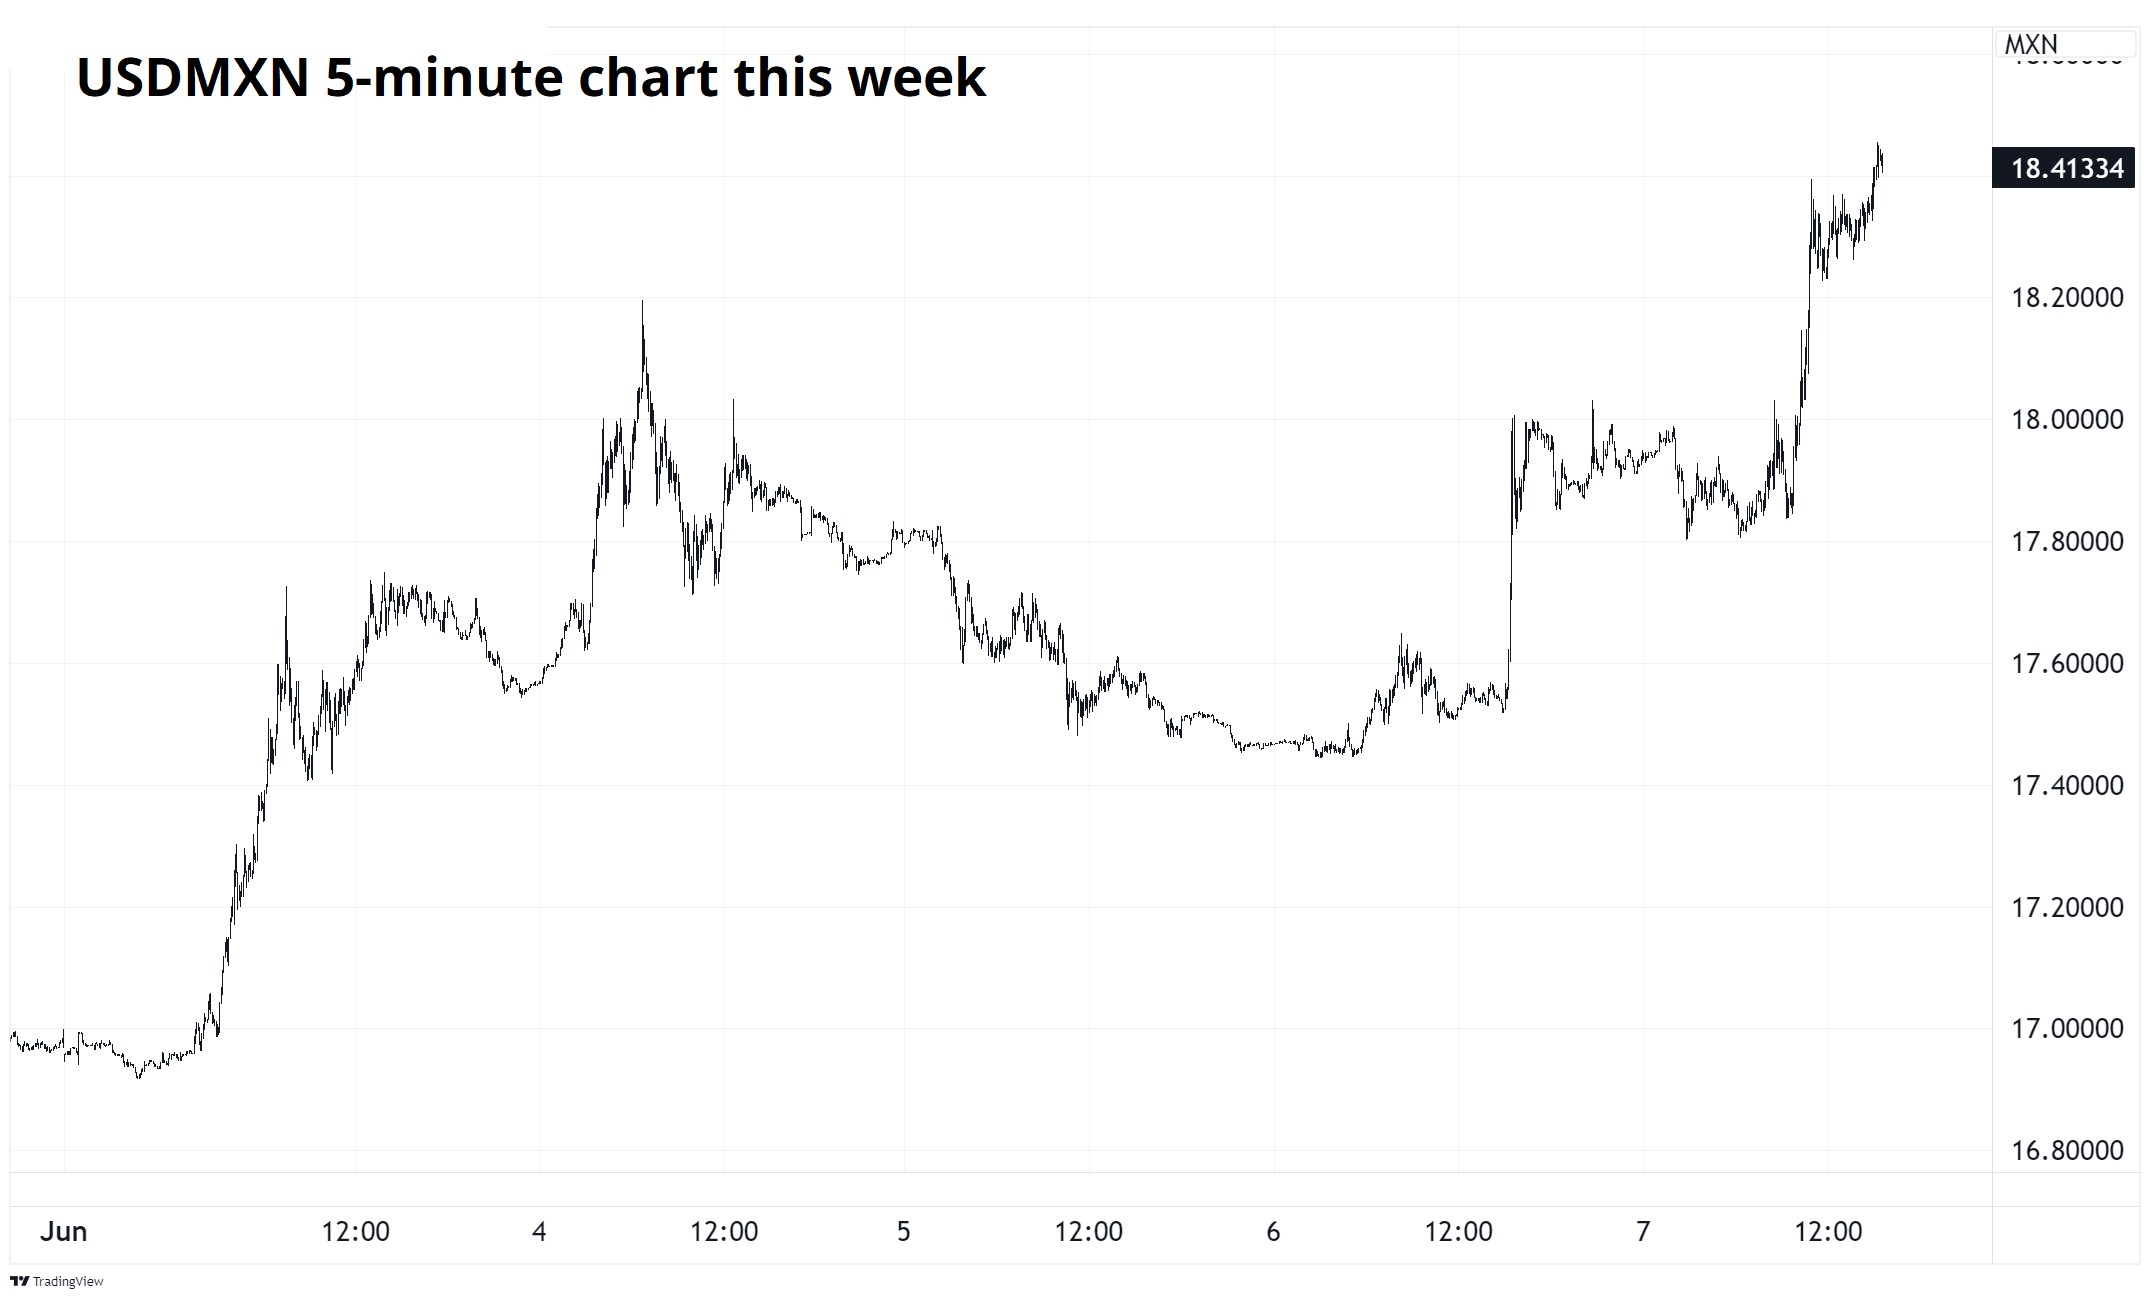
That chart doesn’t really capture the bloodbath in USDMXN, so let’s look at a daily chart.
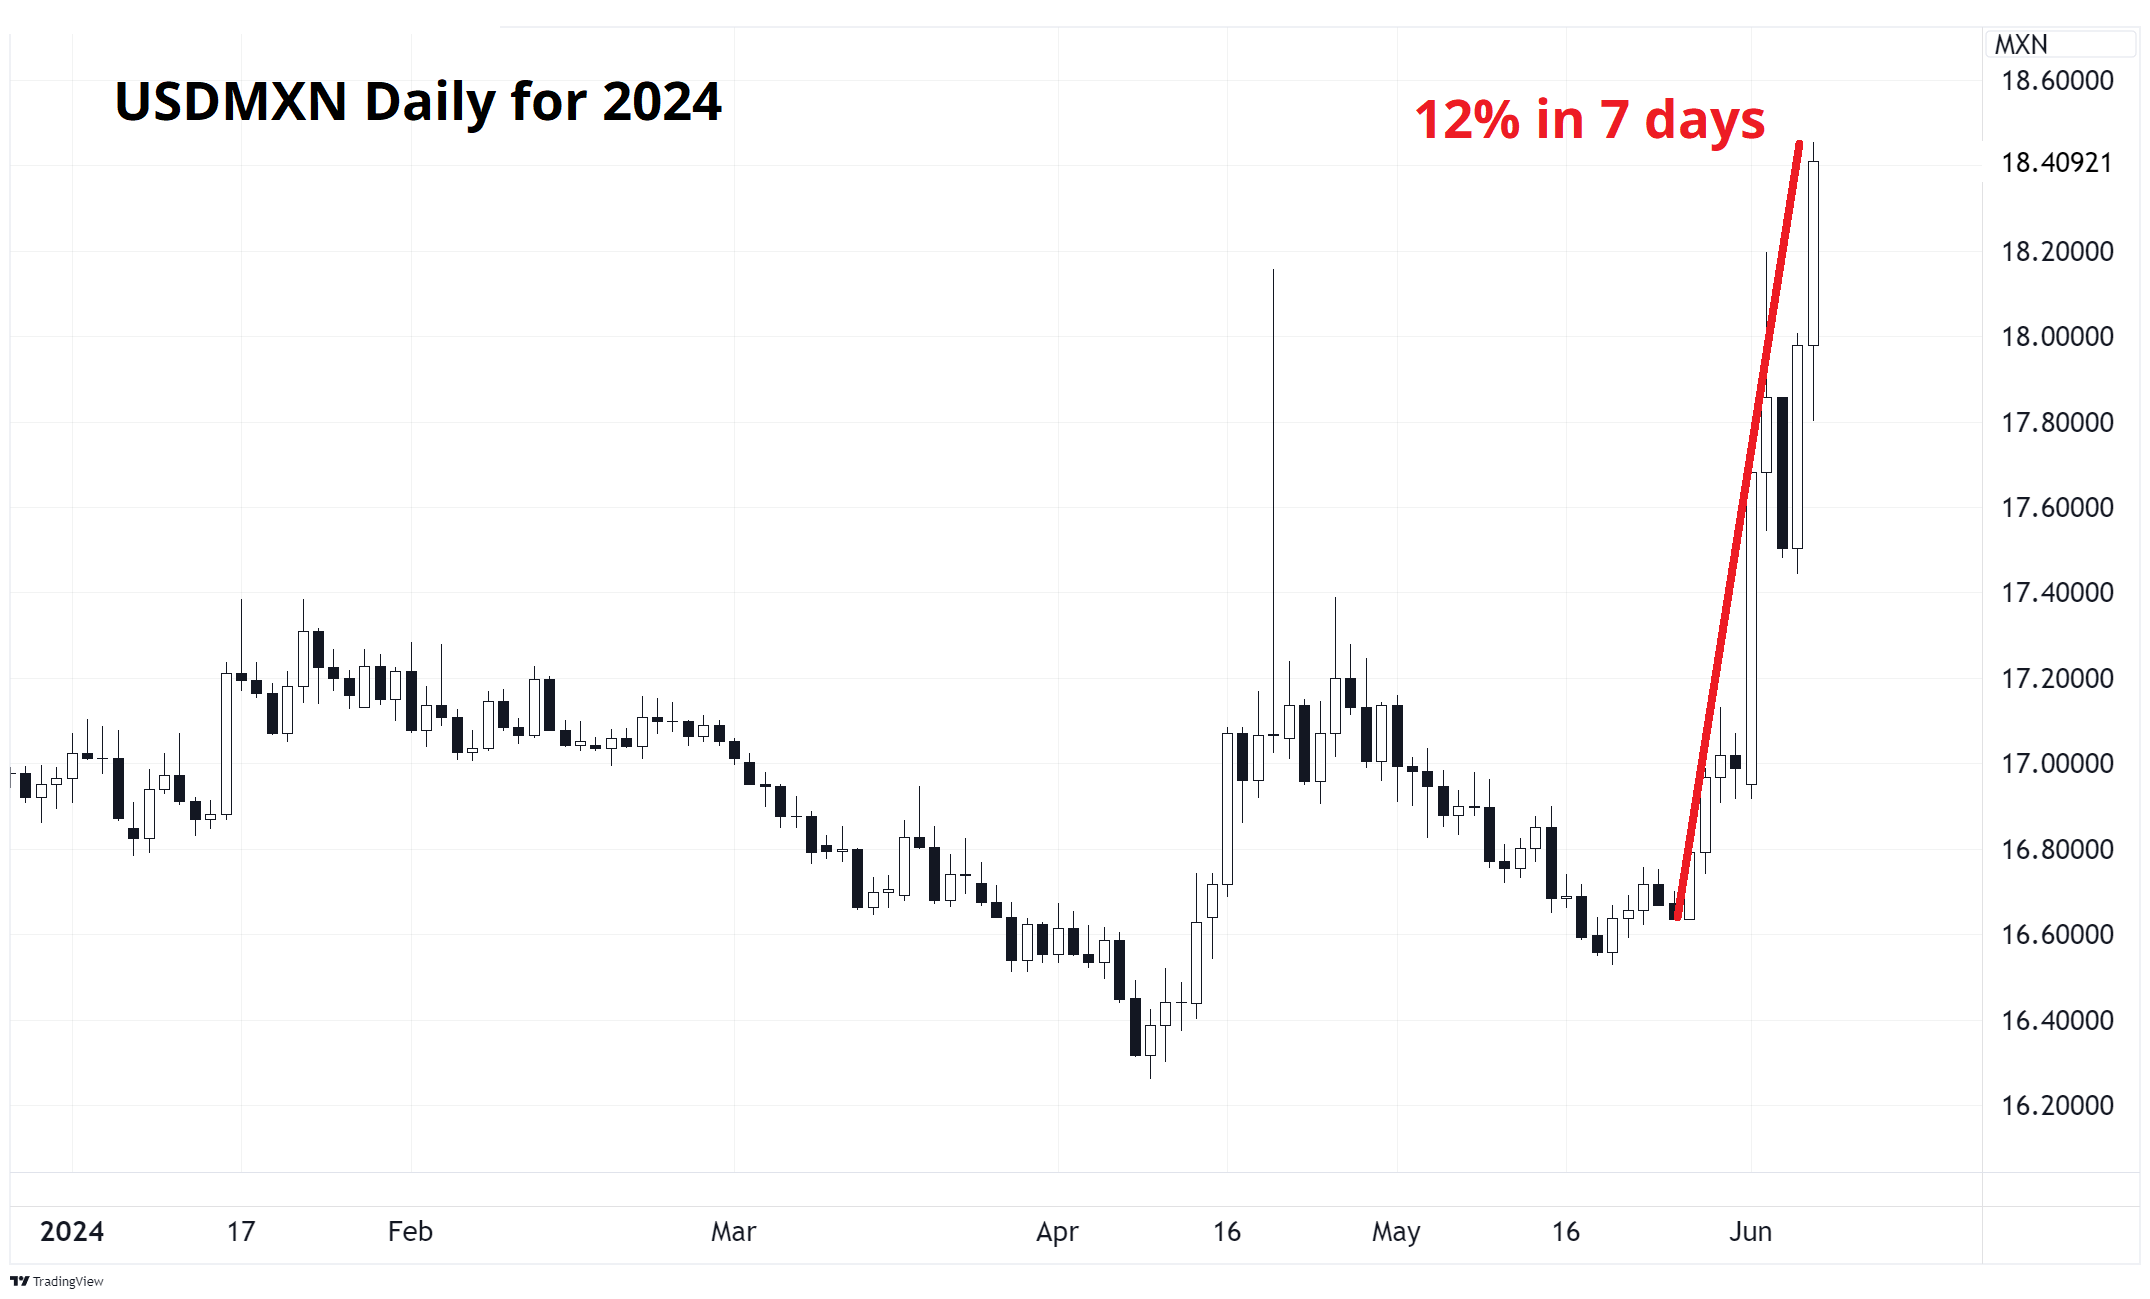
That’s a spicy move. The story is that the Mexican election has changed the political risk premium in Mexico as there is a greater chance of major changes that could increase governmental power. That is a real story, but the move is also driven by massive positioning and severe complacency into the election. Dummies like me were saying the Mexican election would be a nothingburger and nobody was ready for a move like this.
G10 FX has been less caliente, and continues to be a P&L graveyard as USD bulls engage and get slapped down by bad US data, then USD bears engage and get smoked by hot US data. No fun.
Crypto
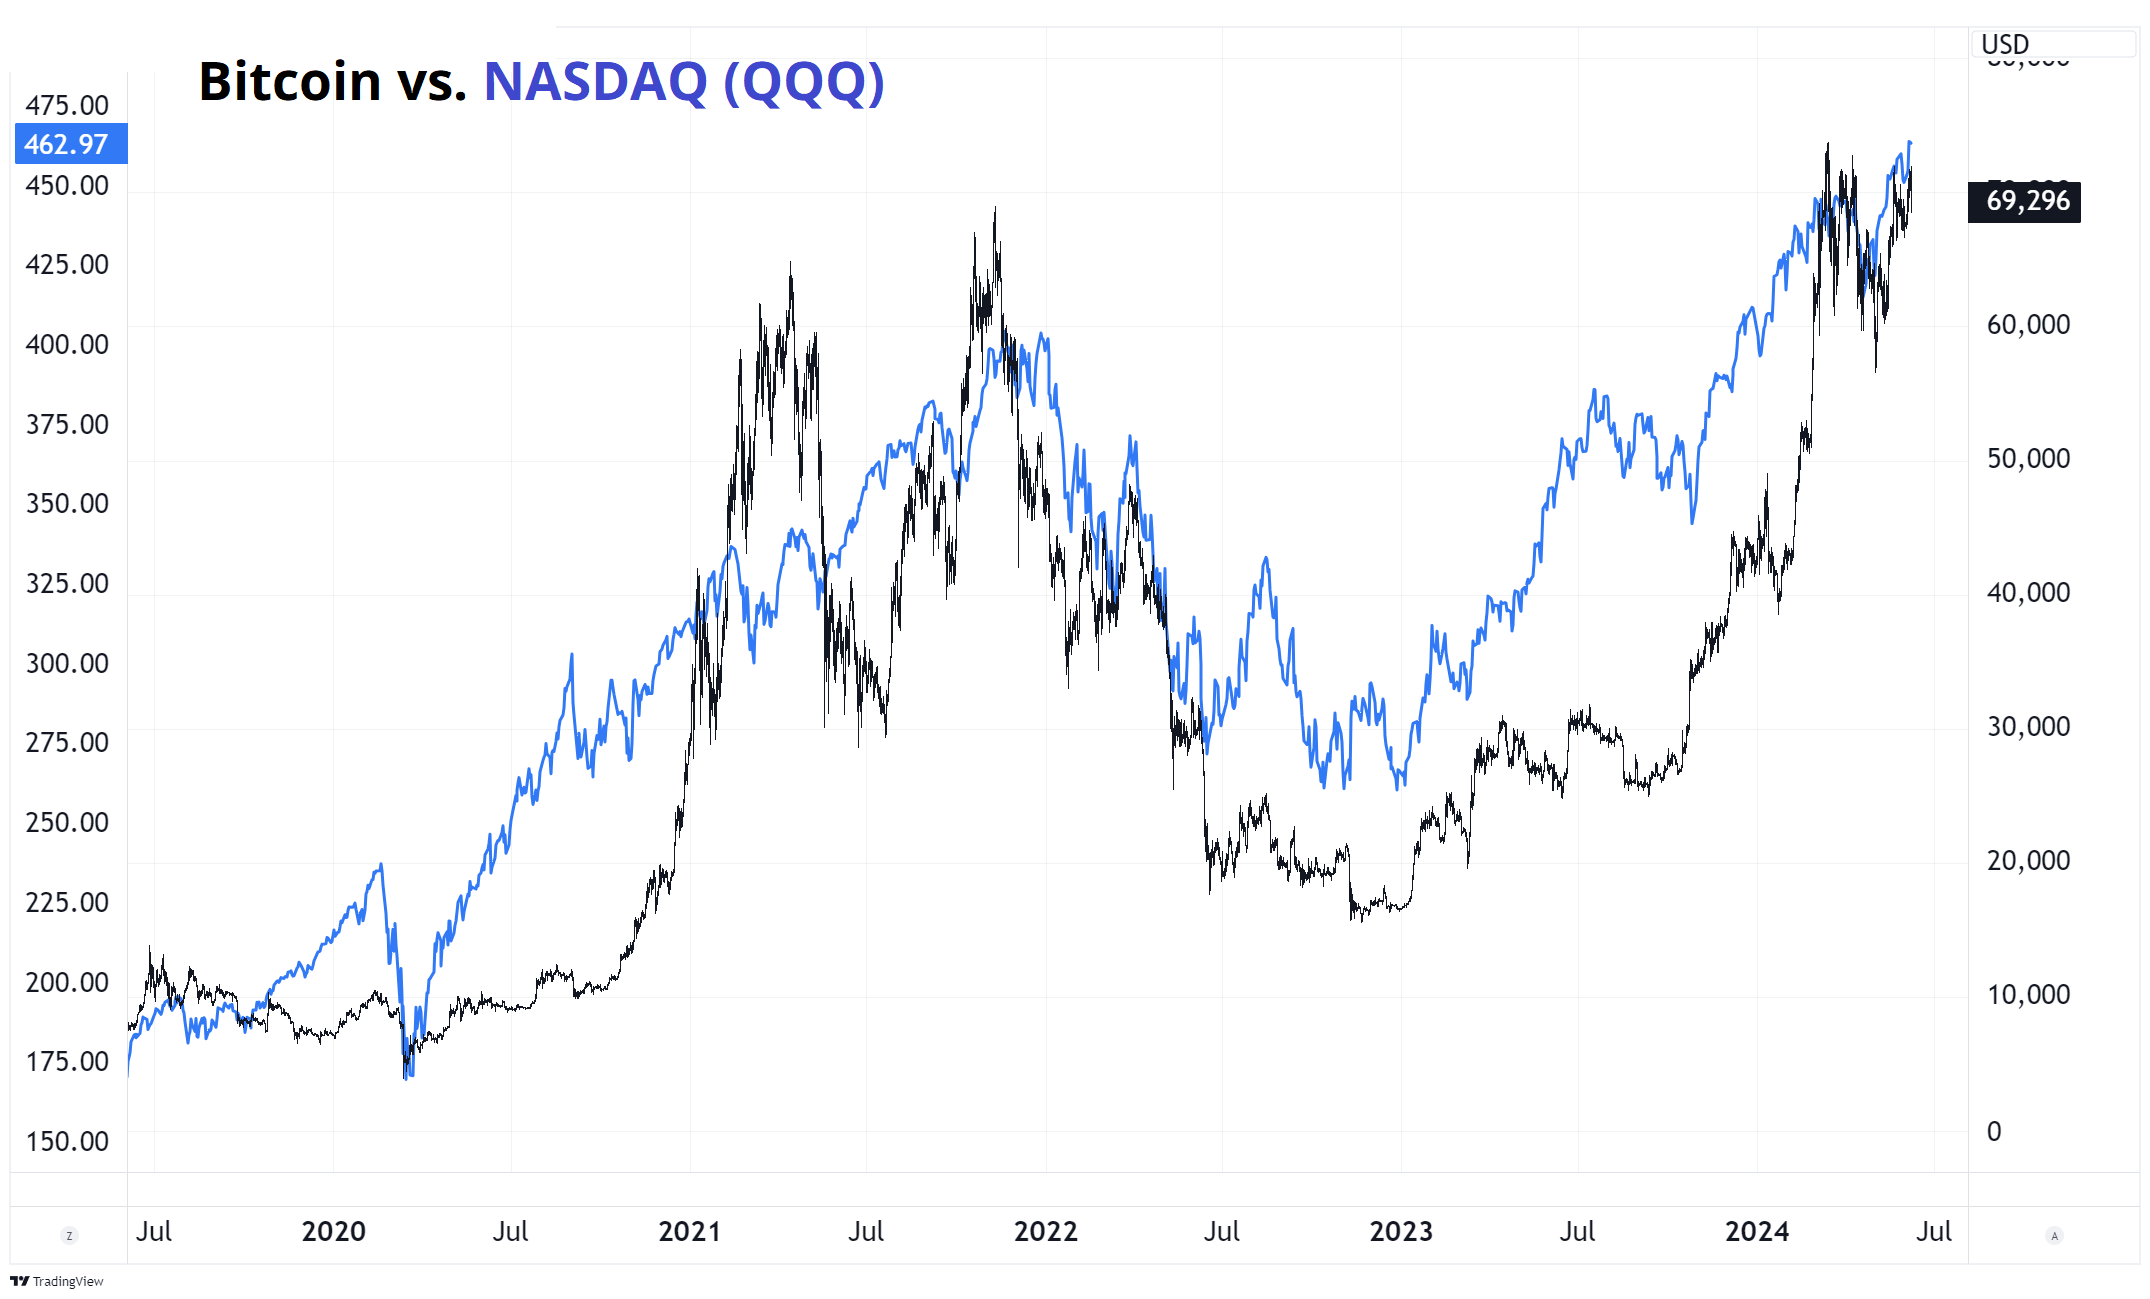
Digital currencies mostly languished this week despite new all-time highs in the NASDAQ. Those two securities continue to be similar, but not identical, as bitcoin functions as a high-beta version of the NASDAQ.
I would think ETH longs are disappointed with their P&L this week as the post-ETF price action has been somnambulant. One thing: An ETH spot ETF without a yield, is a bit like buying a bond ETF that doesn’t pay any dividends. It’s weird. ETH yields 3.5% or whatever. If you buy the ETF, you get zero. That doesn’t seem like a good product to me.
Sure, an ETH ETF opens up a new category of investors for possible participation. But you could say the same thing about an ETF for anything. If someone created an ETF where you can buy real estate, but you don’t get the rental income… I don’t think many people would want that either. While the spot BTC ETF solves a problem, the spot ETH ETF solves a problem while simultaneously creating an equally-bad or maybe-worse problem. So let’s see what happens, I suppose.
Commodities
Oof. Commodities are just never fun for long. I am getting more and more convinced that gold is going to put in a major long-term top around here. It’s outperformed significantly and if you put together a few things like:
China stopped buying

This paper is interesting to me. Is There Still a Golden Dilemma? by Campbell Harvey and Claude Erb, National Bureau of Economic Research (NBER) and Duke University.
Abstract
The real, inflation-adjusted, price of gold is high. Historically, a high real gold price has been associated with low inflation-adjusted gold returns over the subsequent 10 years. Further, historically the realized 10-year rate of inflation has had close to no impact on realized 10-year nominal and real gold returns. An influx of investment in gold (from gold-owning ETFs, Costco shoppers, “de-dollarizing” central banks and possibly others) has seemingly doubled the real price of gold relative to pre-influx times. Today’s golden dilemma is yesterday’s golden dilemma: has an influx of gold buying ushered in a new age of permanently higher “this time is different” real gold prices or is this simply the latest “wash, rinse, repeat” cycle setting-up a significant fall in real gold prices?
It’s a great paper with many solid charts. Like this one:

I am intrigued by this because I am skeptical of buying something just because central banks are buying. Central banks were selling gold the whole time it was below $1,000 and then different central banks started buying when it broke up through $1,500. Not to mention, China bought yards of AUD above 1.00 in 2011/2012 because “AUD is a new reserve currency.” Here is a good snapshot of the narrative at the time.

https://www.marketwatch.com/story/aussie-canada-dollars-termed-reserve-currencies-2012-11-19
AUD was above 1.00 and USDCAD was below 1.00 (!). Following China was not the play! China also bought yards of EURUSD above 1.40 in 2006/2007 because “Twin Deficits”. Central bank flow is huge and persistent, but it doesn’t last forever. And it can produce gross mispricings if the flow is too big for the market to handle.
I have an aversion to any long-term investment with zero or negative carry. The magic of compounding is real.
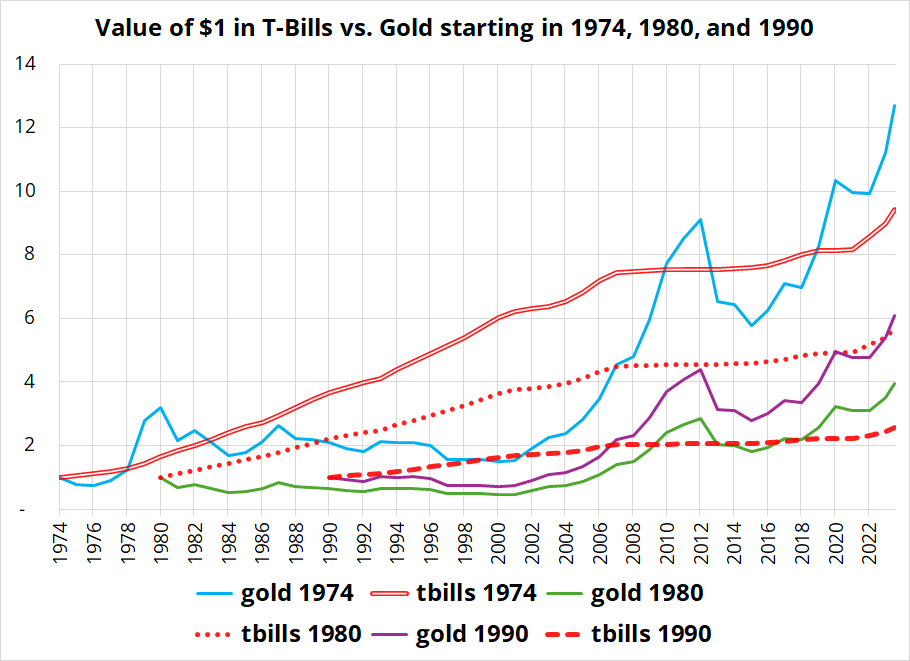
Here is a chart of $1 invested in gold and T-bills at various times. You can read this as “Look, gold outperformed!” or you can read it as “Look, gold outperformed only because of the post-COVID surge and underperformed over almost all other time horizons and now looks far away from the anchor that is the risk-free rate.” This chart corresponds with the idea in the academic paper that there is a simple time component to the gold price where it appreciates gradually over the years because it’s a nominal price. Almost all nominal prices go up over time.
Here’s the chart comparing T-bills to gold with three different starting points. 1974 is significant because that’s the first time Americans could hold gold after the peg break. 1980 and 1990 are just round numbers.
GCM5 is 2465 right now with spot at 2336. I take the under for June 2025.
OK! That was 10 minutes.
Get rich or have fun trying.
Links of the week
Smart, interesting, or funny
- Benjamin Graham has left the chat
How it feels to care about fundamentals when Keith Gill is streaming while drunk and maybe high?
- Today is the last episode of Wheel of Fortune hosted by Pat Sajak!
After 40 years, and 8,000 episodes… He seems like a pretty decent man I must say!
- The Macro Trading Floor podcast
Maybe not smart, interesting, AND funny. But possibly one or two out of three?
Amazing Highlights from Sports That Use Bats
Upset of the Century
For one day, Americans care about cricket! One of Team USA’s main players also works at Oracle!


The hardest pitcher in baseball faces the best hitter in baseball
This video probably only for real baseball fans
Nice catch!
Women’s College World Series of Softball, let’s go.


