Both USDJPY and NASDAQ are back where they started their recent moves from, and I don’t see a great trade idea on either one yet.
Push and Pull
It was a week of crosscurrents and contradiction

Both USDJPY and NASDAQ are back where they started their recent moves from, and I don’t see a great trade idea on either one yet.

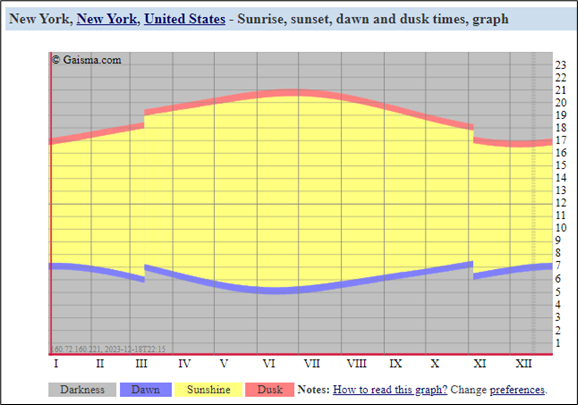
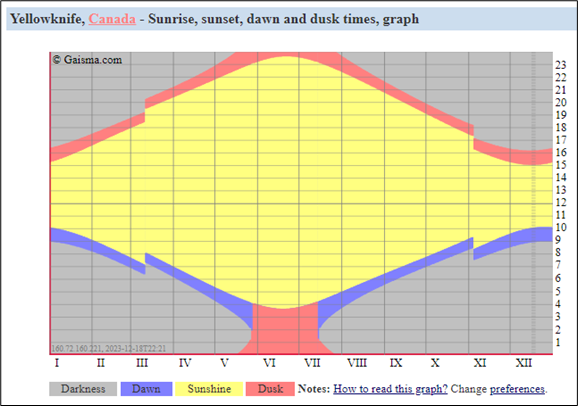
Can you guess what this graphic is showing?
Answer at bottom of page.
Long EURCHF @ 0.9444
Stop was 0.9339.
Moved it up to 0.9434.
Take profit 0.9644
December 19, 2023
Before we get started…
Please click here to complete a quick 2024 survey
It should take about 90-120 seconds. Results in am/FX. Thanks!
The BOJ refused to throw the JPY bulls a bone and we’re in another wipeout mode here but given USDJPY is mostly just a US 10-year yield proxy, we’re awfully high now at 144.40. Technically, it’s a mixed bag as we are now above the 200-hour moving averages and they are crossing up, but we are about to revisit the breakdown level post FOMC (145.00/60). See here:
USDJPY vs. 200-hour MAs (simple and EMA) plus US 10-year yield
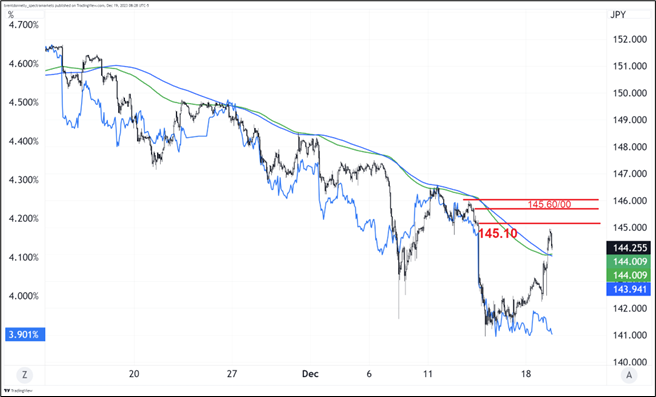
As such, I don’t think there is a trade because we’re in no man’s land. If you are keen to sell USDJPY into 2024, your best bet is to sell just ahead of 145 with a stop at 146.25. The first buy zone is the converging moving averages at 144.00 and I expect a consolidation inside the big levels (144.00/146.00). Note that 10-year yield at the lows works as a bit of a drag on upside USDJPY but with the Fed pushing back on cuts and the short-term inflationary impact of the Red Sea attacks, I think yields are done going down for now.
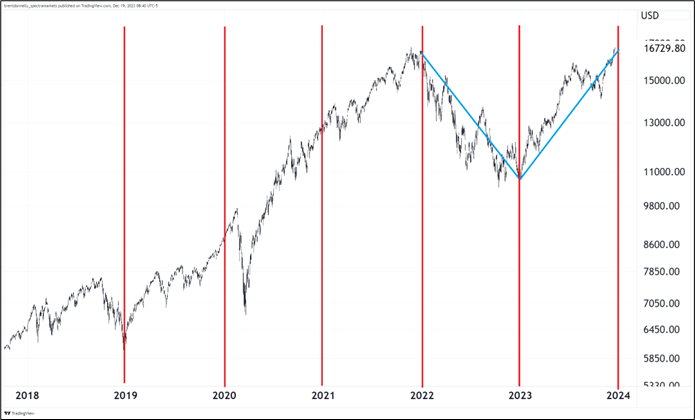
The NASDAQ has just done a perfectly symmetrical round trip from 16700 to 10400 to 16700. The move down took exactly one year and covered 2022 while the rebound took exactly one year and covered 2023. We close the year in a mirror image of how we closed last year: Equity sentiment fully bullish, CNN Fear and Greed at Extreme Greed, megatech overweights locked in, investment banks raising their S&P forecasts, and recessionistas in hiding.
This creates a strong temptation to think about going short in the new year, but it’s hard to make a convincing argument for lower stocks right now, other than positioning and a few tech levels.
NASDAQ daily, 2018 to now
I was curious if finishing the year low like this in VIX means much for future returns. The results are in that long table below. It does look like there’s a bit of a regime break at 20 VIX, but otherwise not too much to see here. As one might suspect, when the year ends in a more fearful state (VIX above 20), returns in Q1 and for the year are, on average, significantly higher.
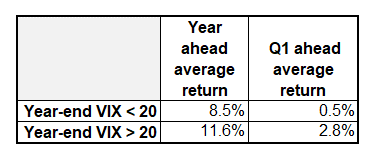
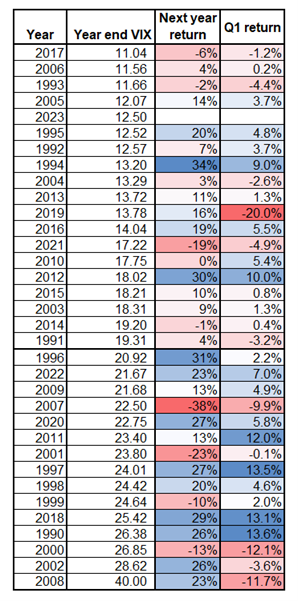
This is logical, but does not scream “bear market!” It just means that starting points matter and we are at an extremely euphoric starting point going into 2024.
With the dovish FOMC meeting and then pushback from the Fed deputies, I think the best approach to Q1 is to simply ignore the Fed communication and focus on the data. If we get a strong run of data, the market will move closer to the deputies’ wishes and if we get weaker data the market will press its bets. The data matters more than the Fed comms.
Don’t forget to order your Spectra Trader Handbook and Almanac so you get it before the new year!
It’s going to be a bright, bright, sunshiny day.
The Spectra FX Positioning and Momentum Report
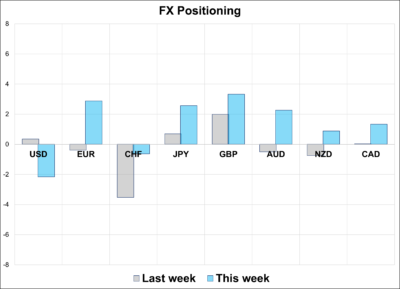
Hi. Welcome to this week’s report. The market is modestly and nervously short USD as we approach the end of a year where seasonality and positioning have been more reliable than macro narratives. The CFTC had a huge GBP long earlier in the year, finally bottled it and went short… And has now flipped back to long with a major purchase of GBP over the past few weeks. Odd.
Three Observations
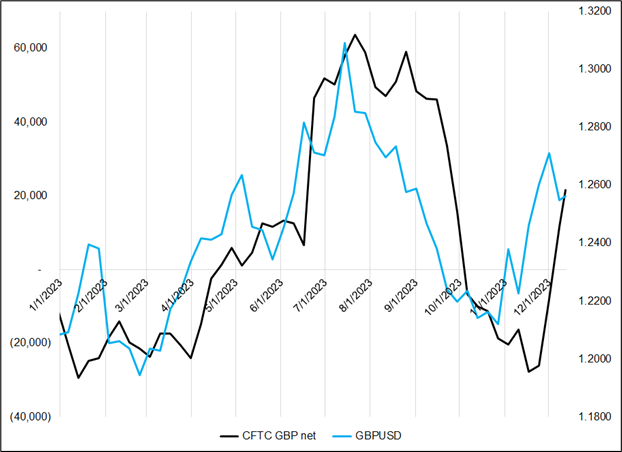
1. When we map CFTC GBP positioning against GBPUSD price action this year, you can see that GBPUSD (the cyan line) is close to unchanged, and positioning has been chasing the price all year. As GBPUSD rallied in April, positioning followed, and months after GBPUSD peaked in July 2023, positioning capitulated. Now, GBPUSD started rallying again in November and we see a concomitant ratchet up in positions again. This is the nature of trend-following systems; they don’t do very well in up/down markets. The GBP position is not yet large enough to send out a contrarian signal.
CFTC GBP position vs. GBPUSD
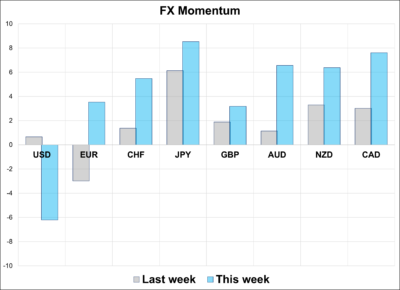
2. EUR has less momentum than the other currencies in this dollar sell off because:
3. The huge JPY short in the market is sufficiently pared back that positioning is no longer a relevant consideration in USDJPY. It can go either direction from here, without facing any impediment from positioning. This is in contrast to the large short yen highlighted in this report during November (when USDJPY was above 150). While some are betting on a hawkish BOJ, others are thrice bitten four times shy and would rather just leave the JPY alone. The net position is small long JPY, mostly via options, and nothing to be concerned about.
—
G10 FX Positioning and Momentum Scores

That’s this week’s report. Thank you for reading.

https://www.gaisma.com/en/location/new-york-ny.html
Pretty cool way of showing the length of the day, by time of year.
Yellow is daytime.
Gray is night.
X-axis is the time of year (roman numerals represent the month) and y-axis is time of day.
The one for Yellowknife is cool (extreme Northern Canada)
It was a week of crosscurrents and contradiction

The risk reversal is a bit of a yellow flag in euro, even though I don’t want to believe it
