
I feel like some kind of missionary for the headline data because so many analysts are looking past uniformly strong US data in an attempt to find danger below.

Here’s what you need to know about markets and macro this week
Global Macro
I was in Brazil last week. Sorry for the lack of Speedrun.
Next week I will send it out Thursday because I’m going to be driving all day next Friday. I made my recaps from the Brazil trip free because I thought you might find them interesting:
https://www.spectramarkets.com/amfx/back-in-usa-part-1/
https://www.spectramarkets.com/amfx/back-in-usa-part-2/
There are certain topics that I find myself beating the drum on more than others, like Turnaround Tuesday during bear markets, or the Magazine Cover Indicator. When I do that, I risk becoming the “Turnaround Tuesday” guy but hey. Right now I feel like some kind of missionary for the headline data because so many analysts are looking past uniformly strong US data on the surface in an attempt to find danger below the waterline.
As Manoj Ramnani put it in a recent note: It’s the Bigfoot Recession. And if you’re at all familiar with US Bigfoot enthusiasts, they are true believers who will find any sort of evidence possible to confirm their prior hypothesis (Bigfoot is real!).
The most extreme example of Bigfoot Economics is the assertion that the household survey of employment somehow tells a more accurate story than Nonfarm Payrolls or Initial Claims. I will show you a few pictures and you tell me whether or not you see Bigfoot.
First of all, some basic statistics:
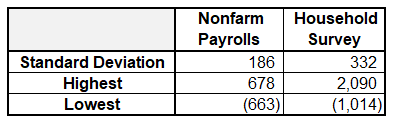
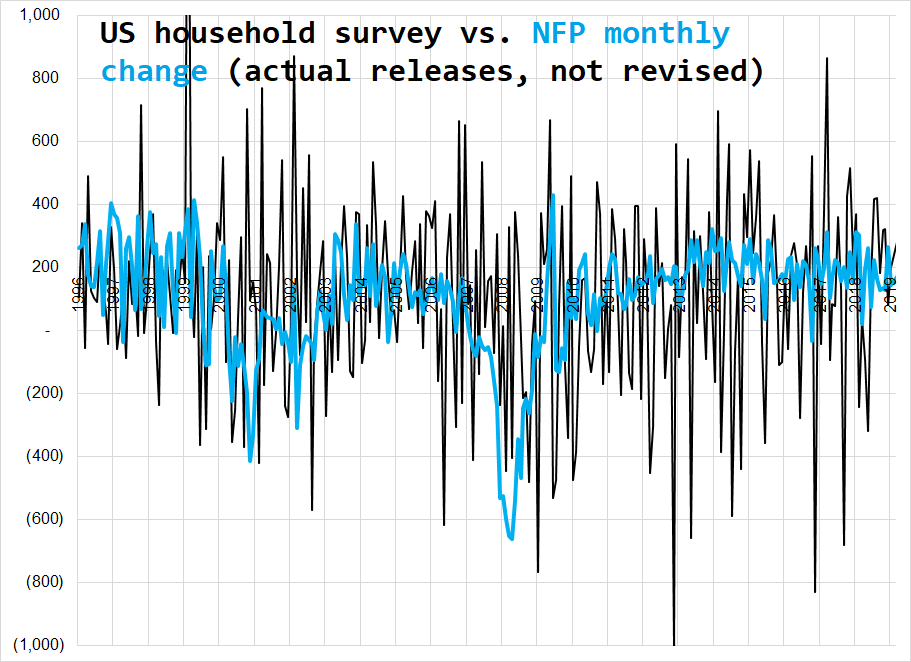
Immediately you can see the problem. The Household Survey is all over the place. But is it all over the place in a reliable way? Let’s compare the data using the pre- and post-COVID periods. You cannot look at 2020 and 2021 economic data because it is a raging outlier period that blows up the y-axis.
1996 to 2019
2022 to 2024
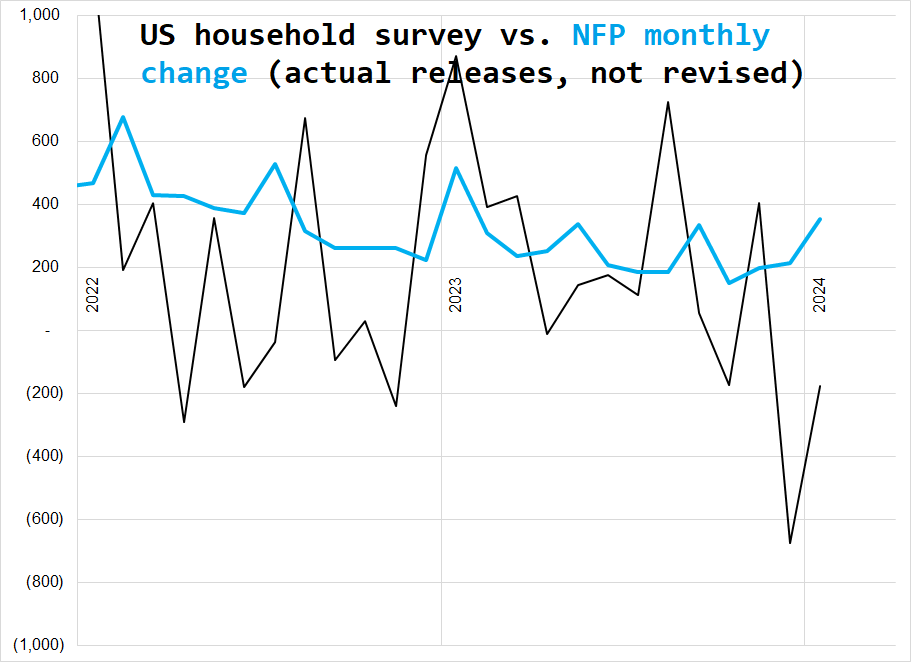
So essentially the household survey is nonfarm payrolls with a massive noise factor added. Now I have seen some people say the divergence between the household and establishment survey (NFP) is predictive. It’s not. Here’s the difference between household and establishment surveys (big positive number means household survey showing strength). The gray vertical zones are the two recessions before COVID.
Household Survey, 000’s of jobs above or below Nonfarm Payrolls
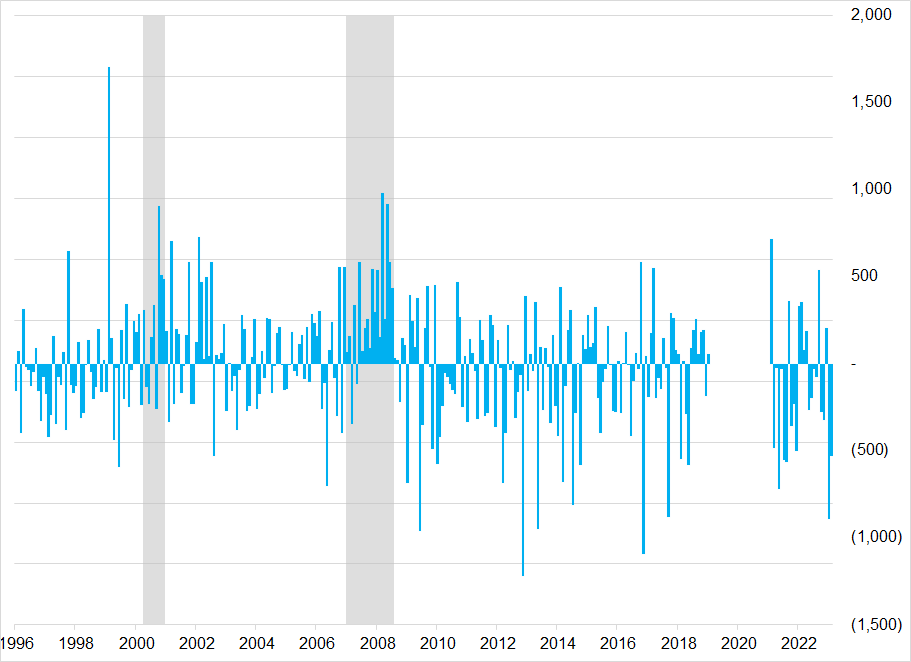
Note that the negative numbers are clustered when the economy is strong and the positive numbers are clustered around recessions. Also note the household survey has been weak for more than two years relative to NFP and yet the economy keeps on keeping on. Maybe this is boring but “LOOK AT THE HOUSEHOLD SURVEY” is one of those things like “THE BOND MARKET KNOWS SOMETHING” that just drives me nuts for some reason. Thank you for tolerating this diatribe.
Also, one last thing. If the household survey contained useful information, do you really think the market would trade exclusively off nonfarm payrolls each month while completely ignoring the household survey? No. The market ignores the household survey because it’s 100% noise and 0% signal.
The US jobs market is chugging along nicely. It’s come off the overheated boil of the 2021 Fiscal Hypercycle™ and is settling into a normal equilibrium as workers come back to fill roles left by COVID quitters and retirees. There are some warning signs and it’s very hard to tell the difference between a return to equilibrium after overheating and the start of a legit labor market air pocket. I remain in the soft landing camp. If anything, I favor reacceleration over recession. That’s why I have been saying 5 or 6 Fed cuts priced for 2024 is too much.
Housing is ebullient, gas prices are rising again, shipping costs are up, the labor market is strong, and earnings growth is good. The US economy has a ton of support. And the soft data, which I believe is wrong, has been catching up to the hard data as many US businessmen prefer Trump and so as his odds rise, business sentiment should also rise. And that’s exactly what’s been happening. Economic sentiment = political sentiment in 2024.
The overarching thing to remember right now is that this is a cycle like no other. It’s not 1995, it’s not 2018, and it’s not 1999. It’s some weird hybrid of the three. Tech ebullience and soft landing and slowing inflation and dovish Fed and all-time highs in stocks. People are still grumpy but they’re getting less grumpy.
Stocks
Speaking of tech ebullience, I posted this chart on Twitter and I think it helps explain part of why it’s been impossible to short the MAG7. Someone told me after that Ed Yardeni has been talking about this, but I don’t subscribe to his stuff even though I like what I have seen in the past. I just mention this as a pre-emptive rebuttal if I end up investigated for plagiarism by the fine folks at Business Insider.
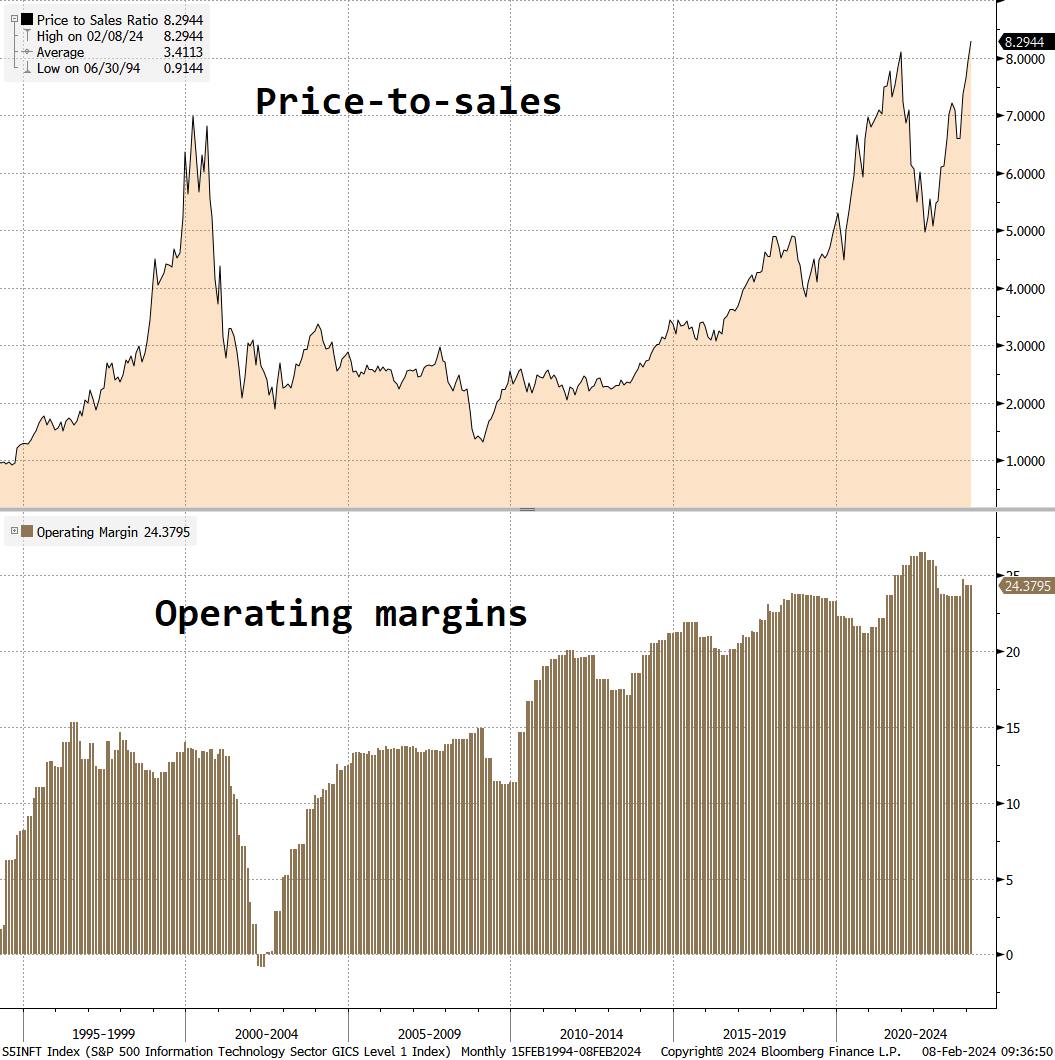
This chart reeks of “It’s a new paradigm!” or “This time is different!” but like … It kind of is? These tech companies are essentially mono- or oli-gopolies and they print money like mad. Maybe that’ll change. I’m not sure. I have been wrong on NVDA for 200 bucks and I am officially placing it in the too-hard pile. Crazy to be long. Insane to be short.
Here are the Godfather’s thoughts on MAG7 if you want some smart stuff to think about.
And here is this week’s 14-word stock market summary:
Buzz Lightyear market. To infinity and beyond! Bigfoot recession lurks but can’t be found.
Interest Rates
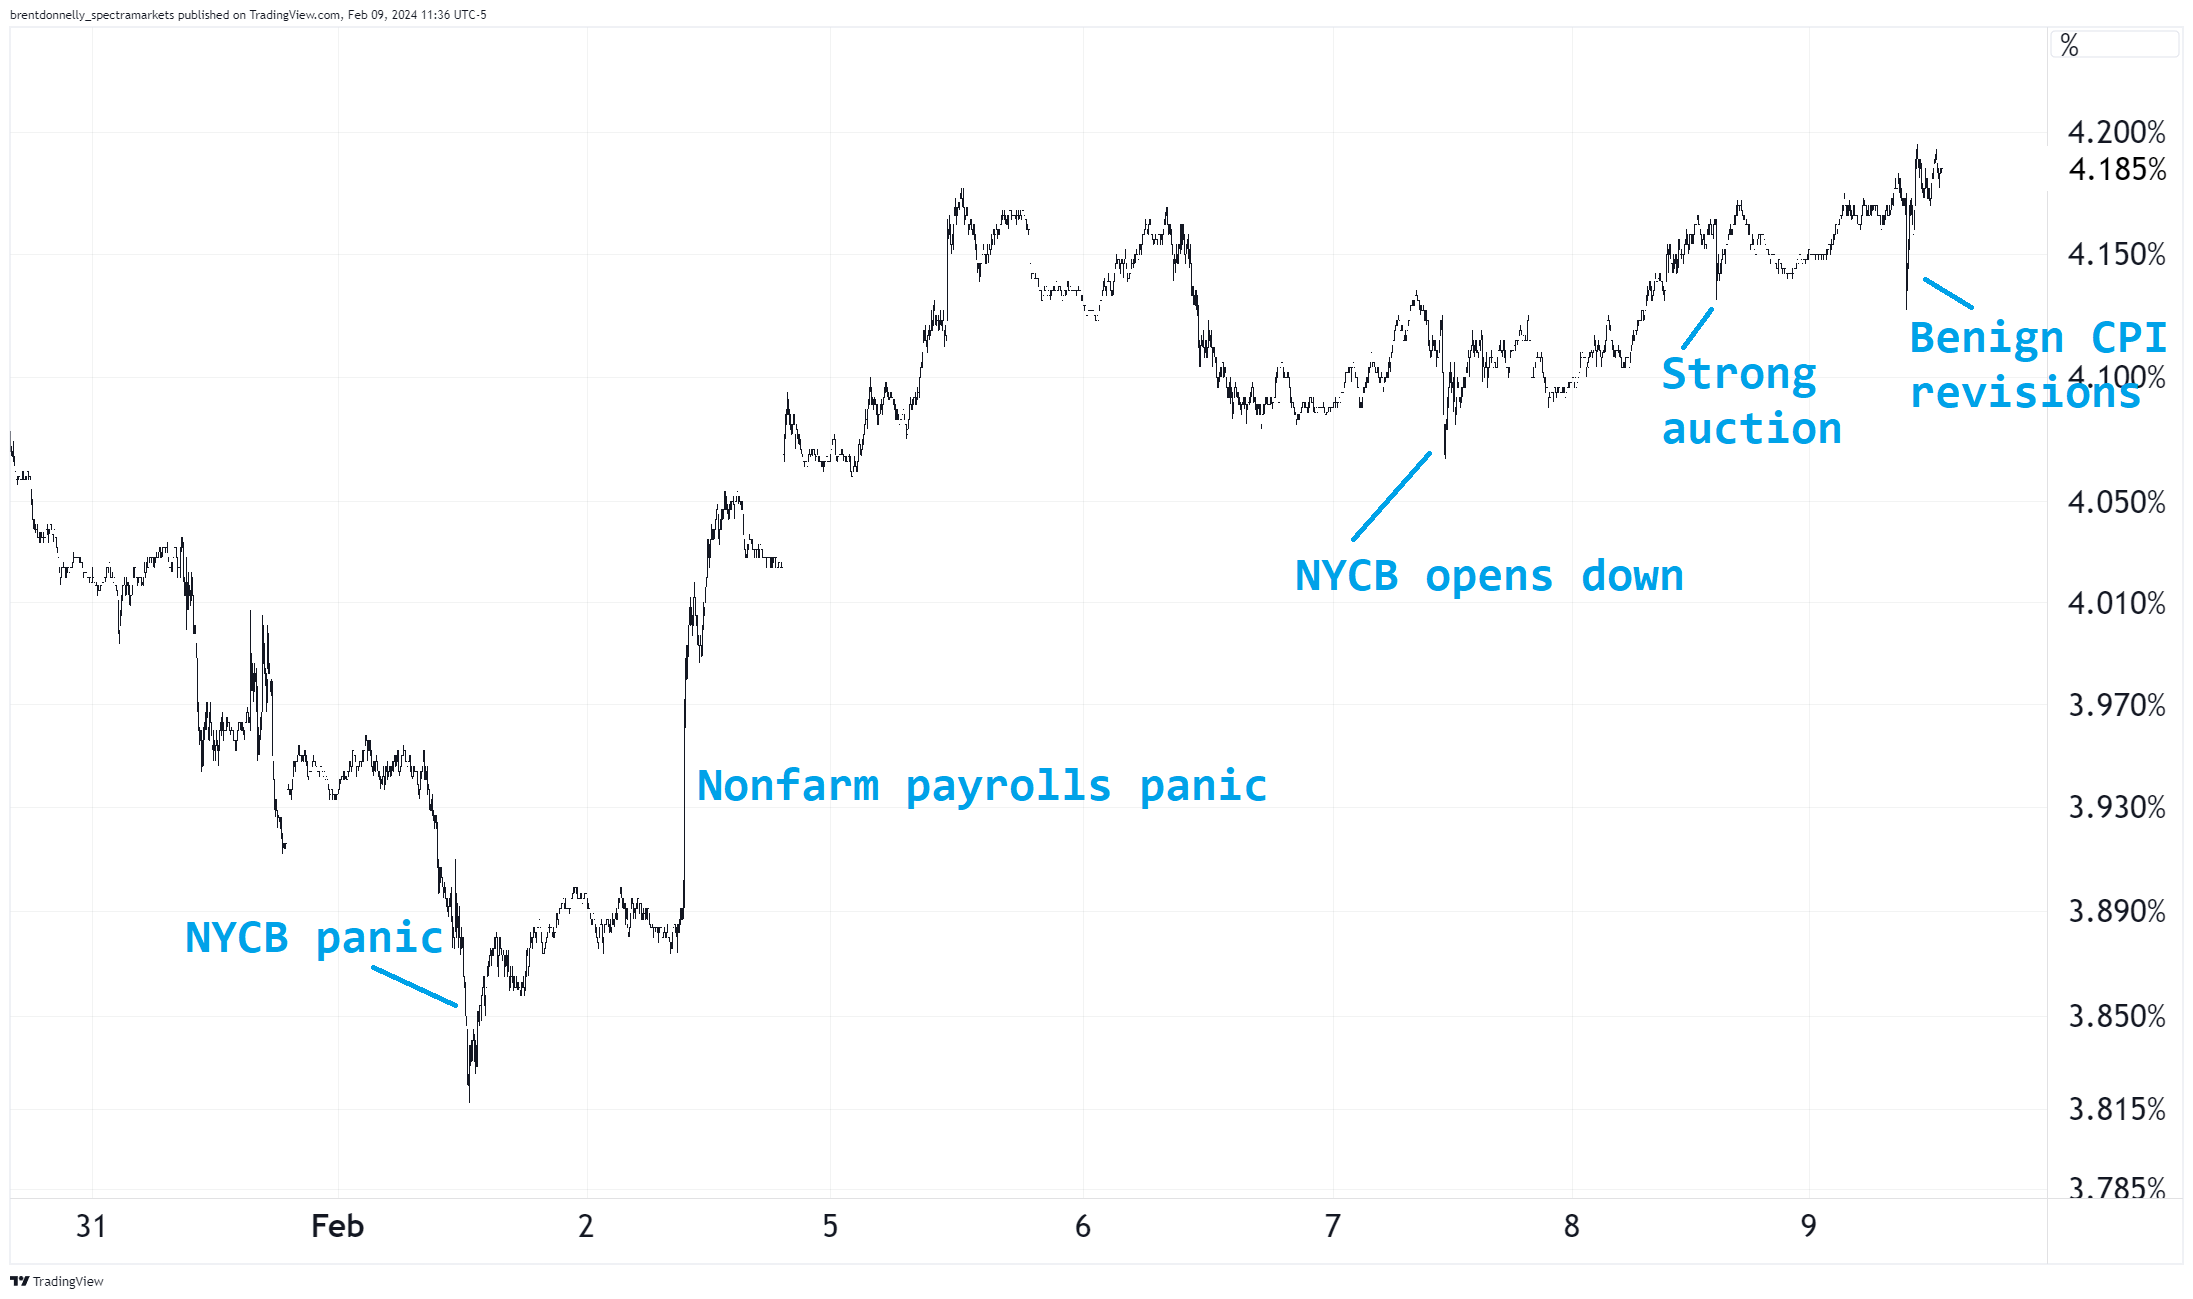
Yields are going up despite some fairly aggressive stabs at the downside. Bonds trade heavy despite a few more rounds of NYCB angst, a strong auction, and benign US CPI revisions on Friday.
US 10-year yield, 5-minute chart back to 31JAN
As noted above, I’m still constructive on the US economy as I think we are just trying to find our new post-normalization happy place. Meanwhile, if you read the pieces I wrote about my trip to Brazil, you will know that everyone I met there was received rates (expecting lower yields) and a friend of mine in London confirmed he is seeing the same thing there. Yes, it makes sense to be received, in theory, as global inflation falls. But if we are already at the lows in inflation and prices start to accelerate higher (a bit)… There could be more pain for global receivers.
(Note for non-rates-experts: Paid rates means you are positioned for yields to go higher. Received rates means you think yields are going lower.)
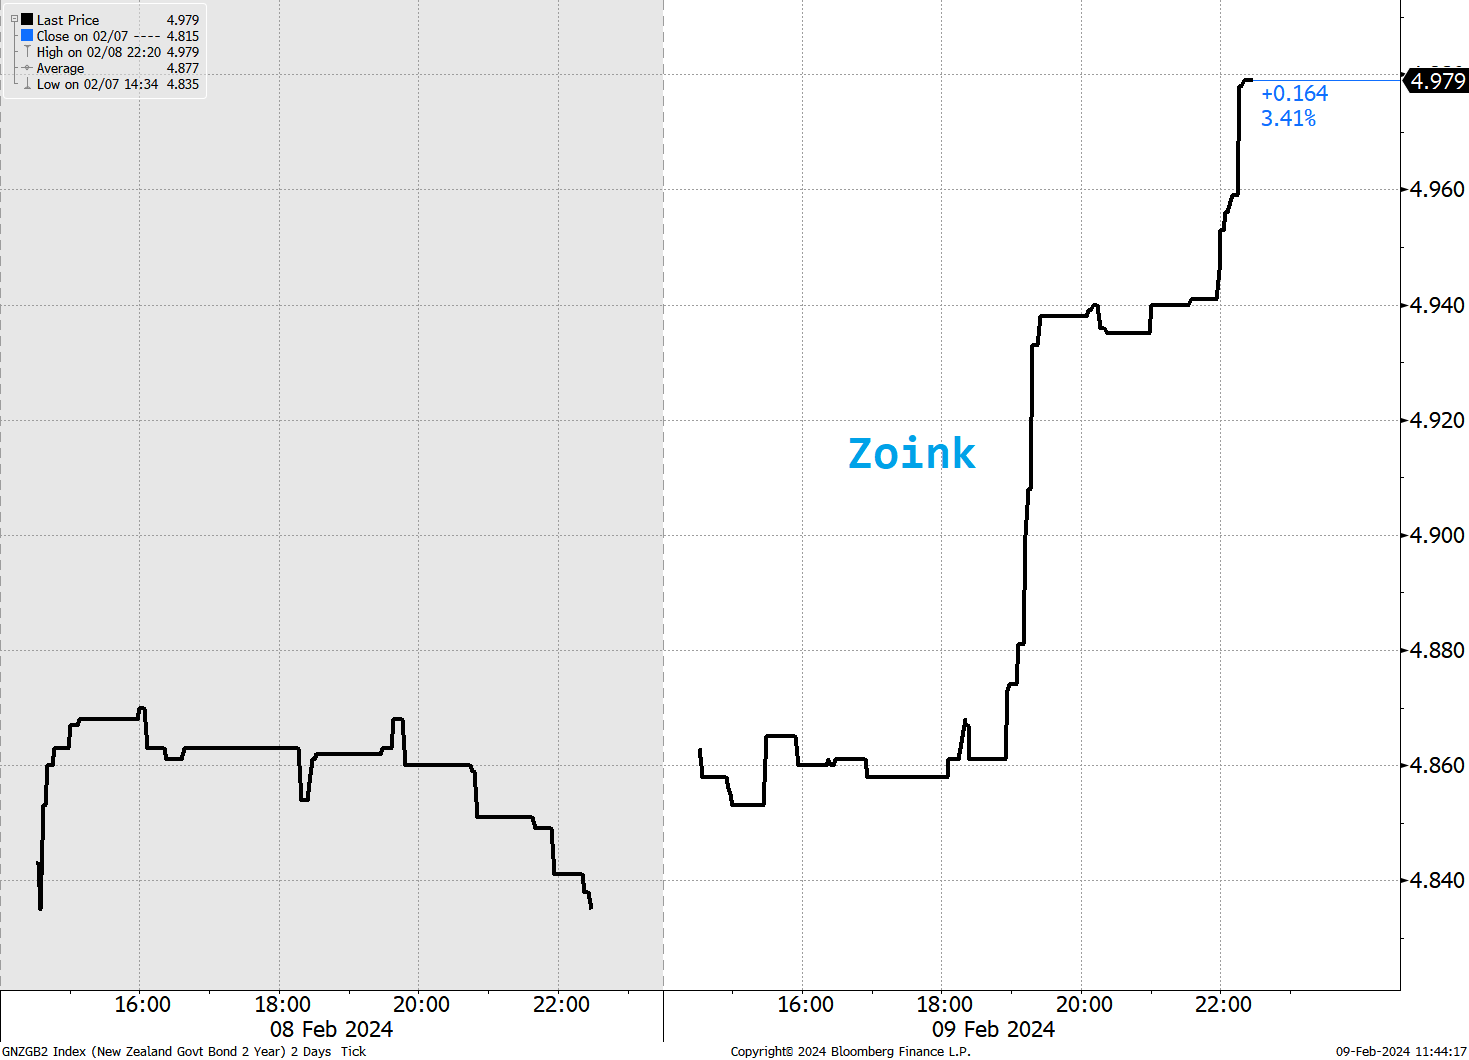
We got a flavor for that positioning unwind issue overnight in New Zealand as one of the rock star economists over there, Sharon Zollner from ANZ Bank, made a brash call for higher NZ yields.
Brash RBNZ call, get it? If you’re over 45 years old, you might.
Here’s the last 2 days in New Zealand 2-year yields. The market had priced interest rate cuts and is now back to pricing hikes. While it’s hard to imagine, this is possible in the United States too! Fed rate cuts are not guaranteed!
New Zealand 2-year yield over the past two days
Next week’s calendar, which you would get every week if you subscribed to am/FX, looks like this:
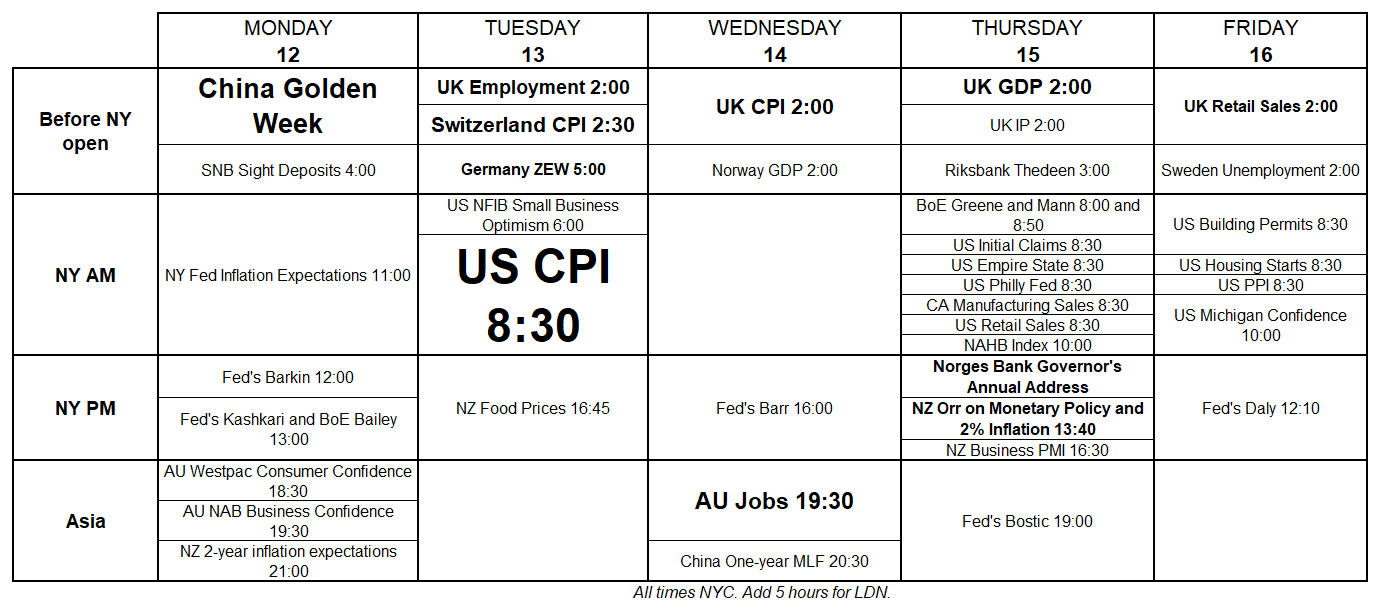
The font sizes and boldness choices are my subjective ranking of the importance of the data points. US CPI is the key, but note the UK puts something out four days in a row and Swiss CPI will capture more attention than usual because everyone is trying to short CHF every day.
Fiat Currencies
The Swiss (the Swiss) they can’t resist. The market is trying to short CHF and the trade makes sense. Inflation is low and falling, the currency is strong, and the central bank is turning dovish. The main issue is that the SNB has absolutely zero credibility when it comes to manipulating the value of the Swiss Franc. They bought EURCHF at 1.50, they bought it all and more at 1.20, they bought more at 1.00 and then they sold for a year below 0.9500. The idea that the SNB going back to CHF selling will lead to a meaningful reversal is hard to embrace.
There will be short CHF trades around SNB policy, but they will be short-term rentals. I am not averse to going short CHF here and there on SNB policy shifts etc., I’m just making the point that SNB selling CHF is laughably unimportant in the big picture after 14 years of watching them flail in FX.
Otherwise, FX has been pretty lame as people are more excited about crypto and cocoa and NET and ARM and NVDA. Those things are flying around while EURUSD trades 1.0725/1.0800 all week.
EURUSD : NVDA be like BUILDING IKEA FURNITURE : BOUNCY CASTLE
AUD continues to trade like an absolute pig and the move higher in NZ yields has taken AUDNZD down to a 1-year low. Yes, AUDNZD is a real thing.
Crypto
Those bids below 36k are still waiting to get filled and crypto is fulfilling its role as a tech proxy pretty well these days. The GBTC overhang is gone and now 48k/49k stands as the band of critical resistance. Here’s BTC vs. NASDAQ—same basic idea but definitely not moving in lockstep.
BTC (blue line) vs. NASDAQ (black bars)
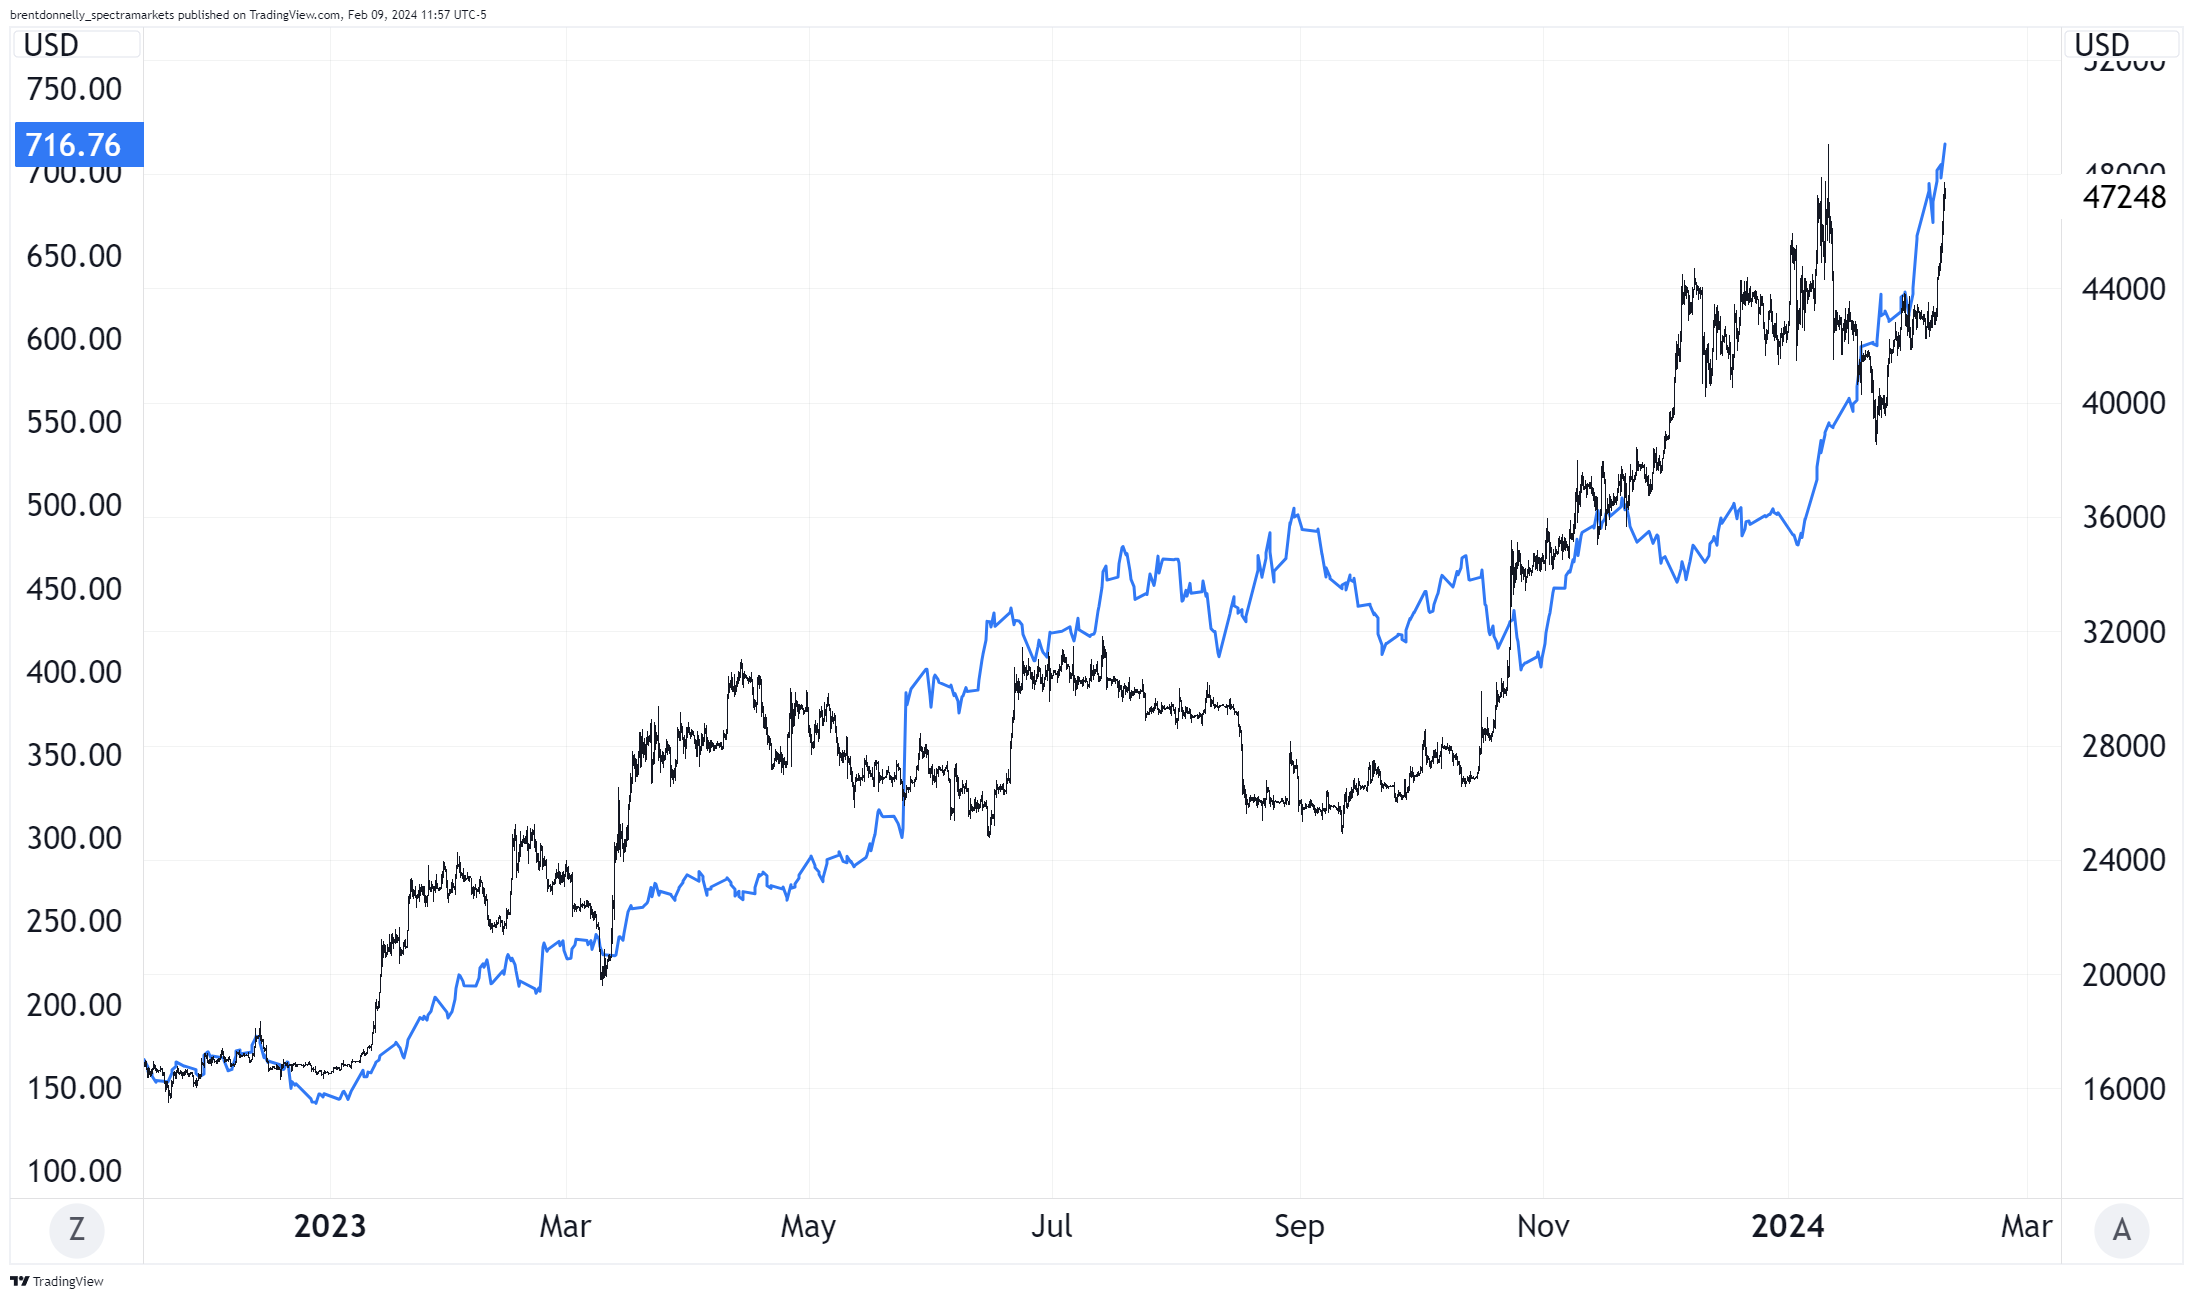
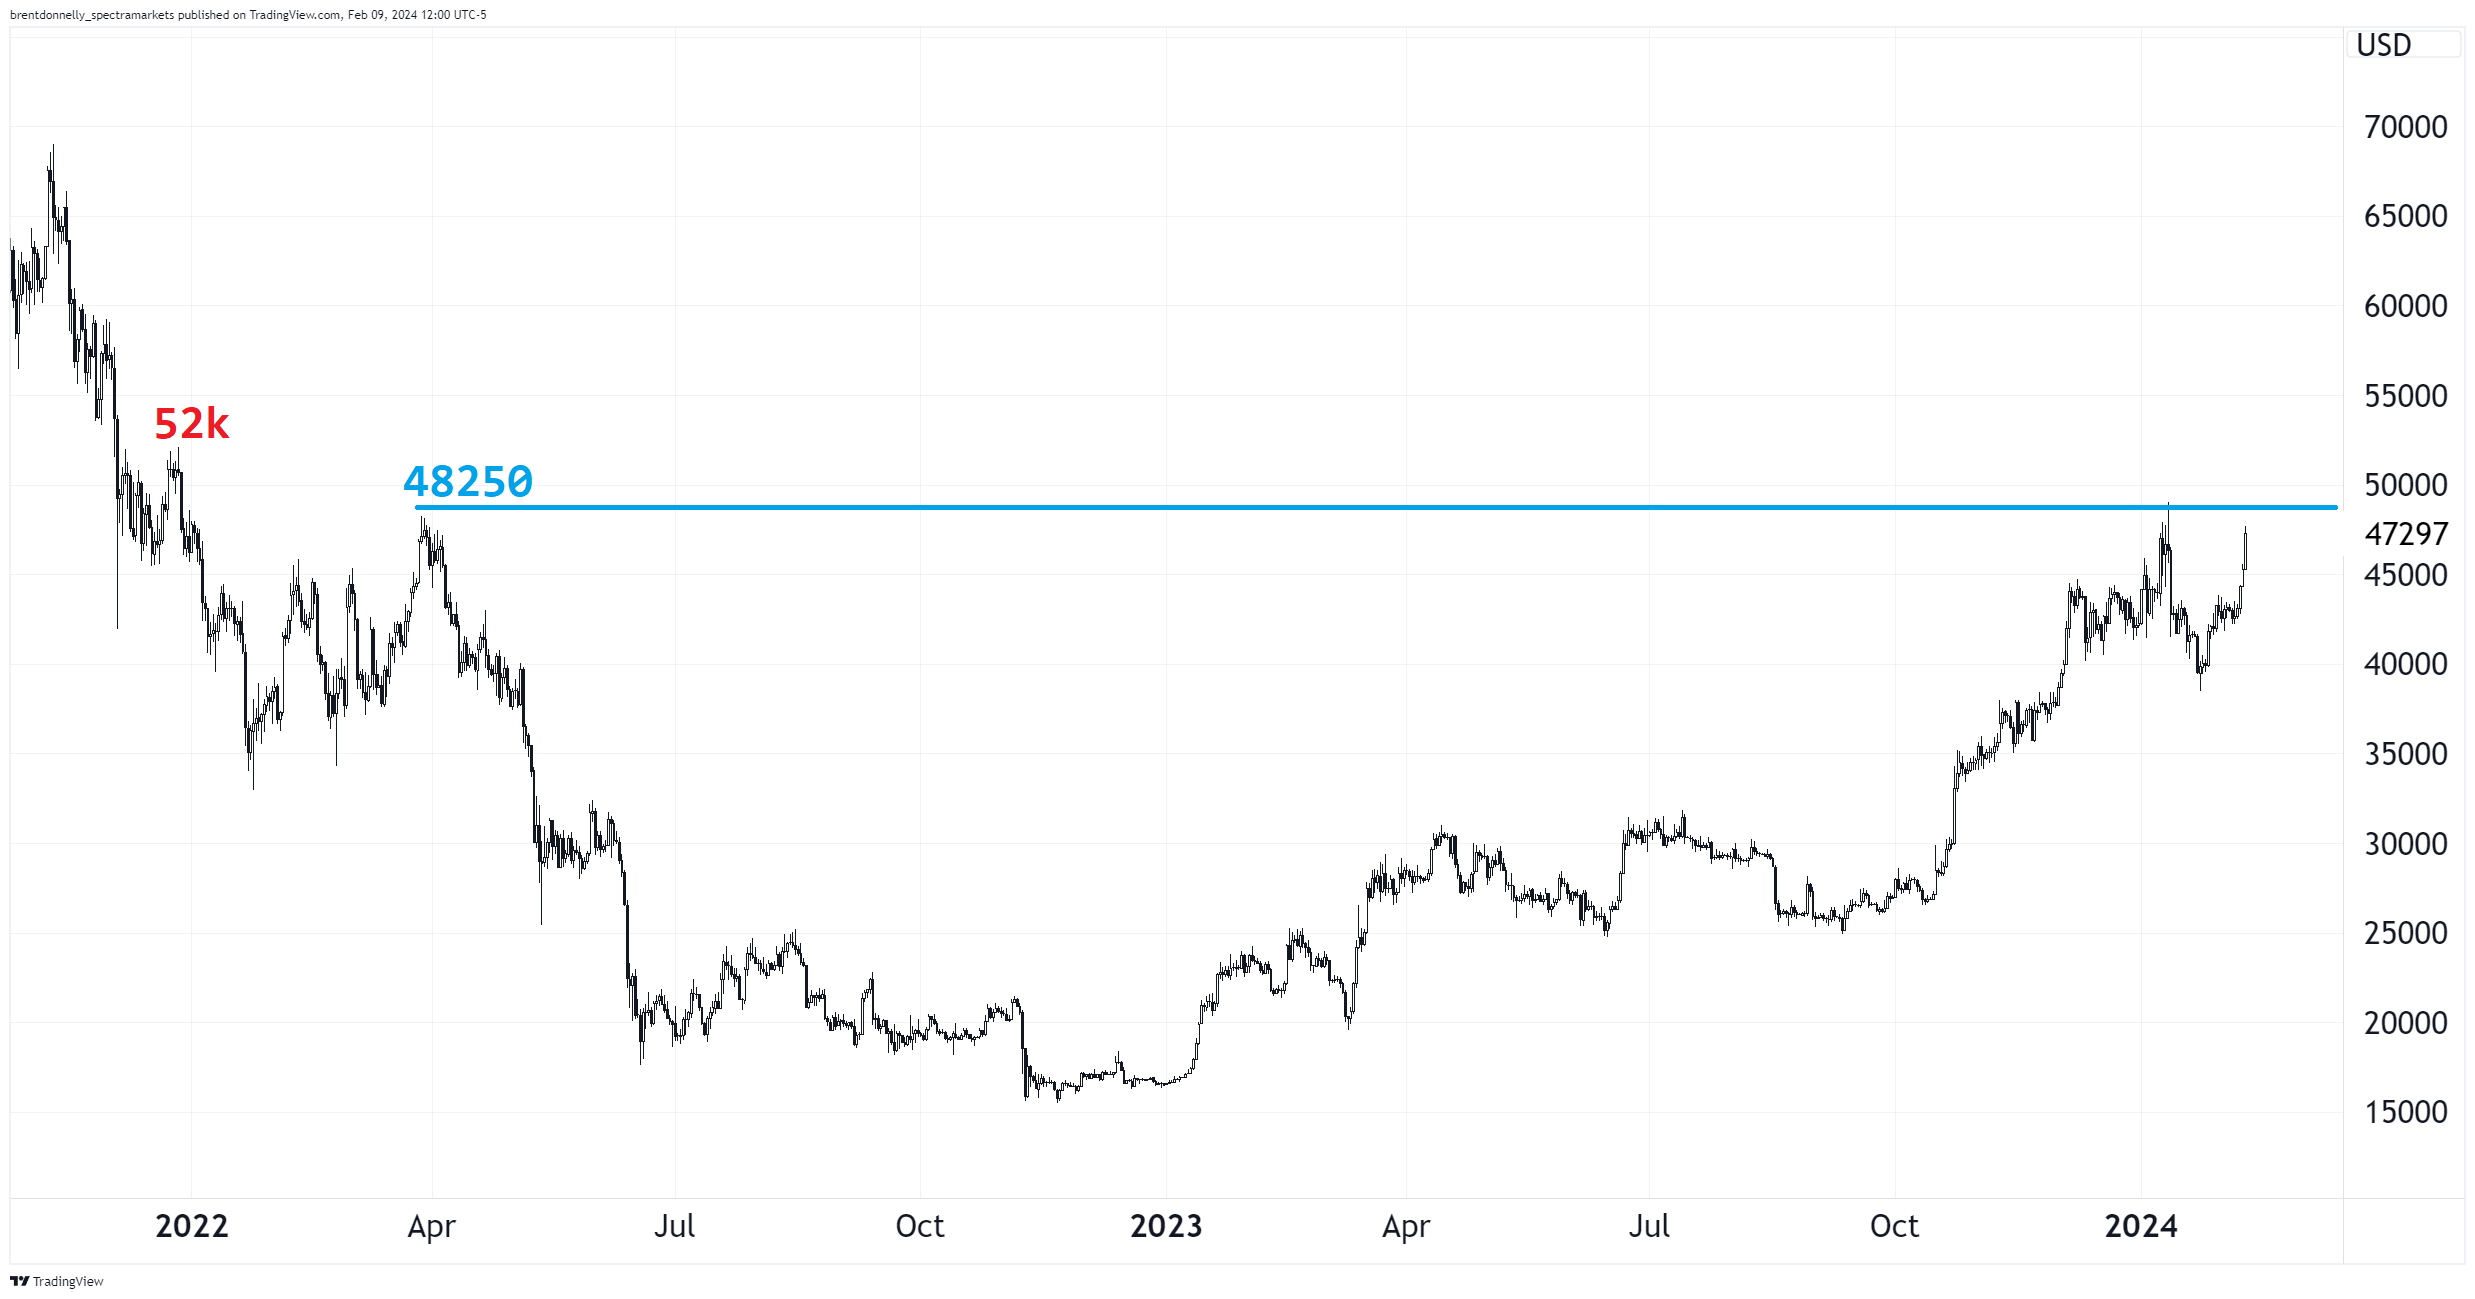
We briefly touched 49,000 after the ETF announcement and then buy rumor / sell fact kicked in so you can look at a clear move above the old resistance (48250, marked on the chart) and 49000 as the breakout.
Bitcoin™!
I would be scared to short bitcoin here in the middle of a face-melting NASDAQ rally, but if forced to take a view my guess is that it holds and we range trade 38k/50k for a long while. It’s vaguely interesting and possibly relevant that stuff like ETH, SOL, MATIC, DOT, and whatever are nowhere near taking out their late 2023 highs even as bitcoin is about 90% of the way there. Perhaps this makes sense if the ETF is drawing in new money now.
Commodities
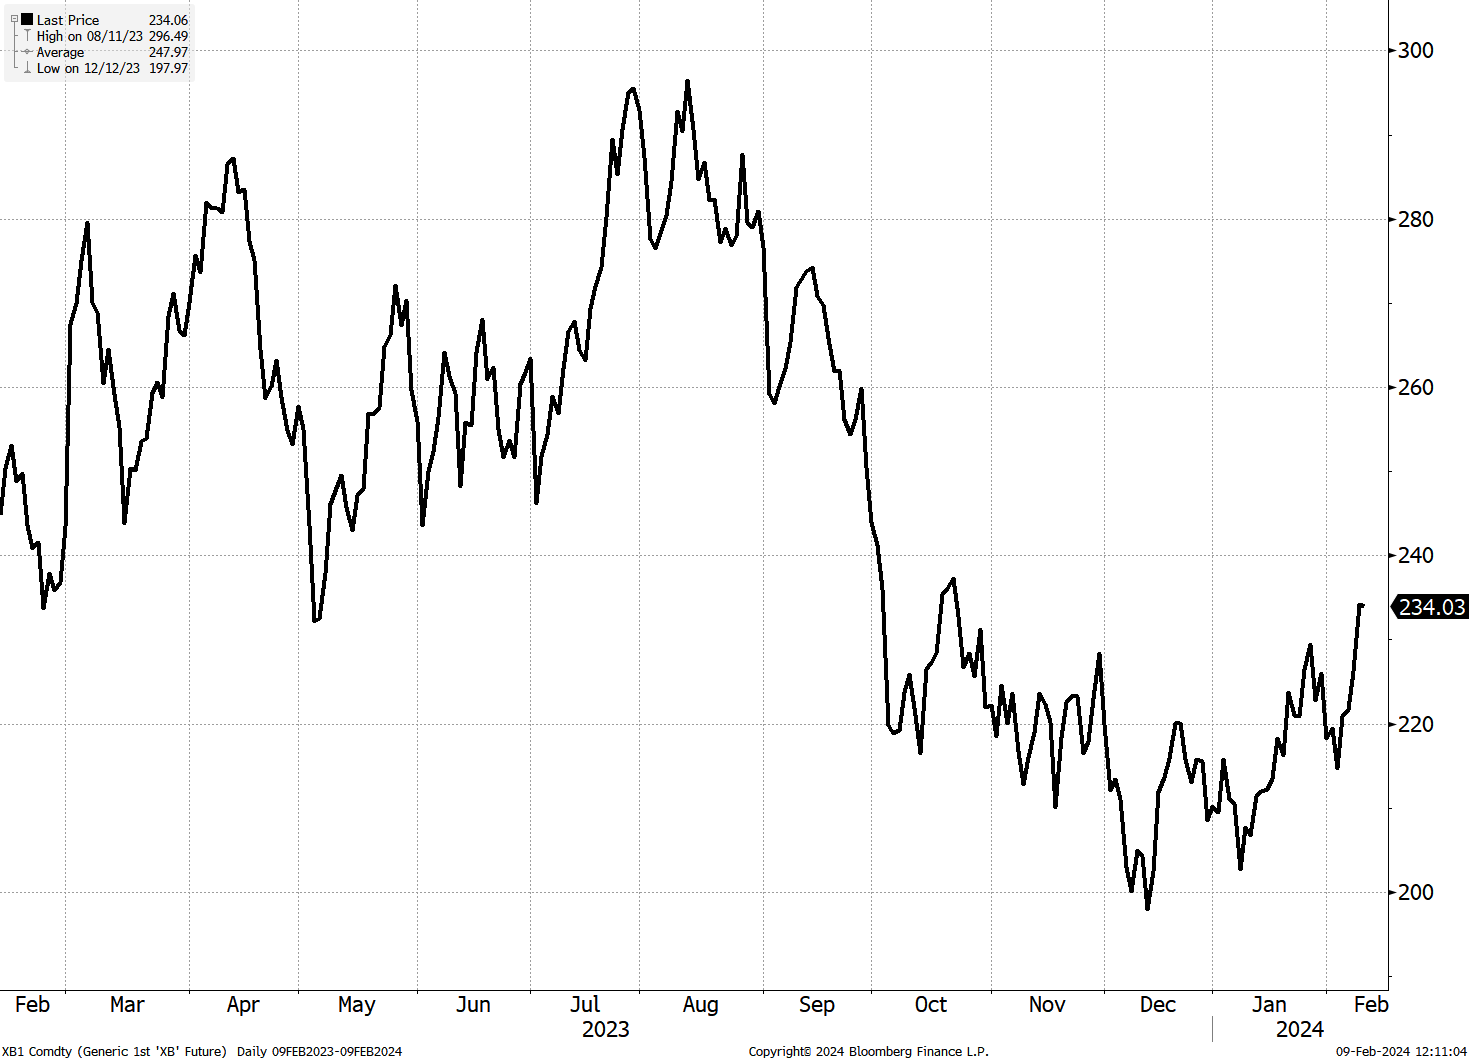
If there’s going to be an inflation reacceleration, it’s probably going to be partly driven by higher gasoline prices simply because that’s usually part of any inflation surge in the United States. So it’s meaningful that gasoline prices are hitting 4-month highs. A zoomed-out look shows they are not in scary territory (at all) but markets operate mostly on rates of change, not levels.
Gasoline prices, 2023 to now
Note that if I was trying to scare you and be dramatic, I would have used a different x-axis and just shown you the price back to the start of 2024. Like this:
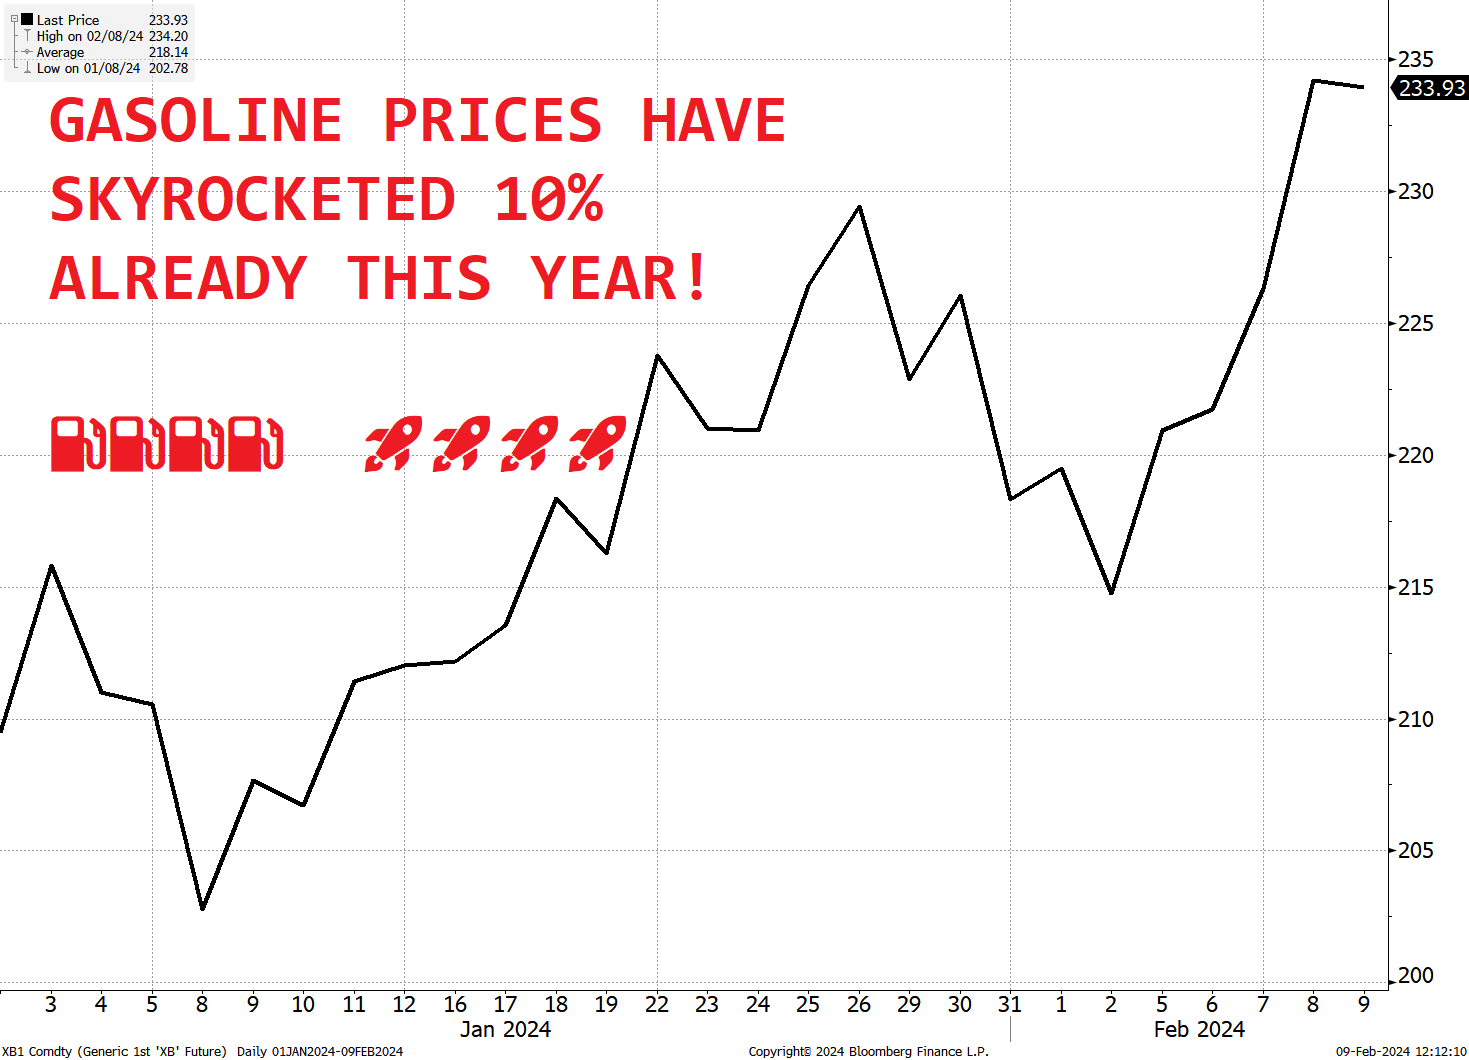
This sort of statistical trickery is obvious when you’re told about it in advance, but often not at all obvious in real time. Spotting this sort of stuff is one of many, many things you will learn in Spectra School’s first course:
Think Like a Market Professional
We are done building the course, but the testing and official launch will still take a few months. Launching ~early Q2. Get excited.

Meanwhile, cocoa has gone loco.
Hourly cocoa (spot), mid-October to now
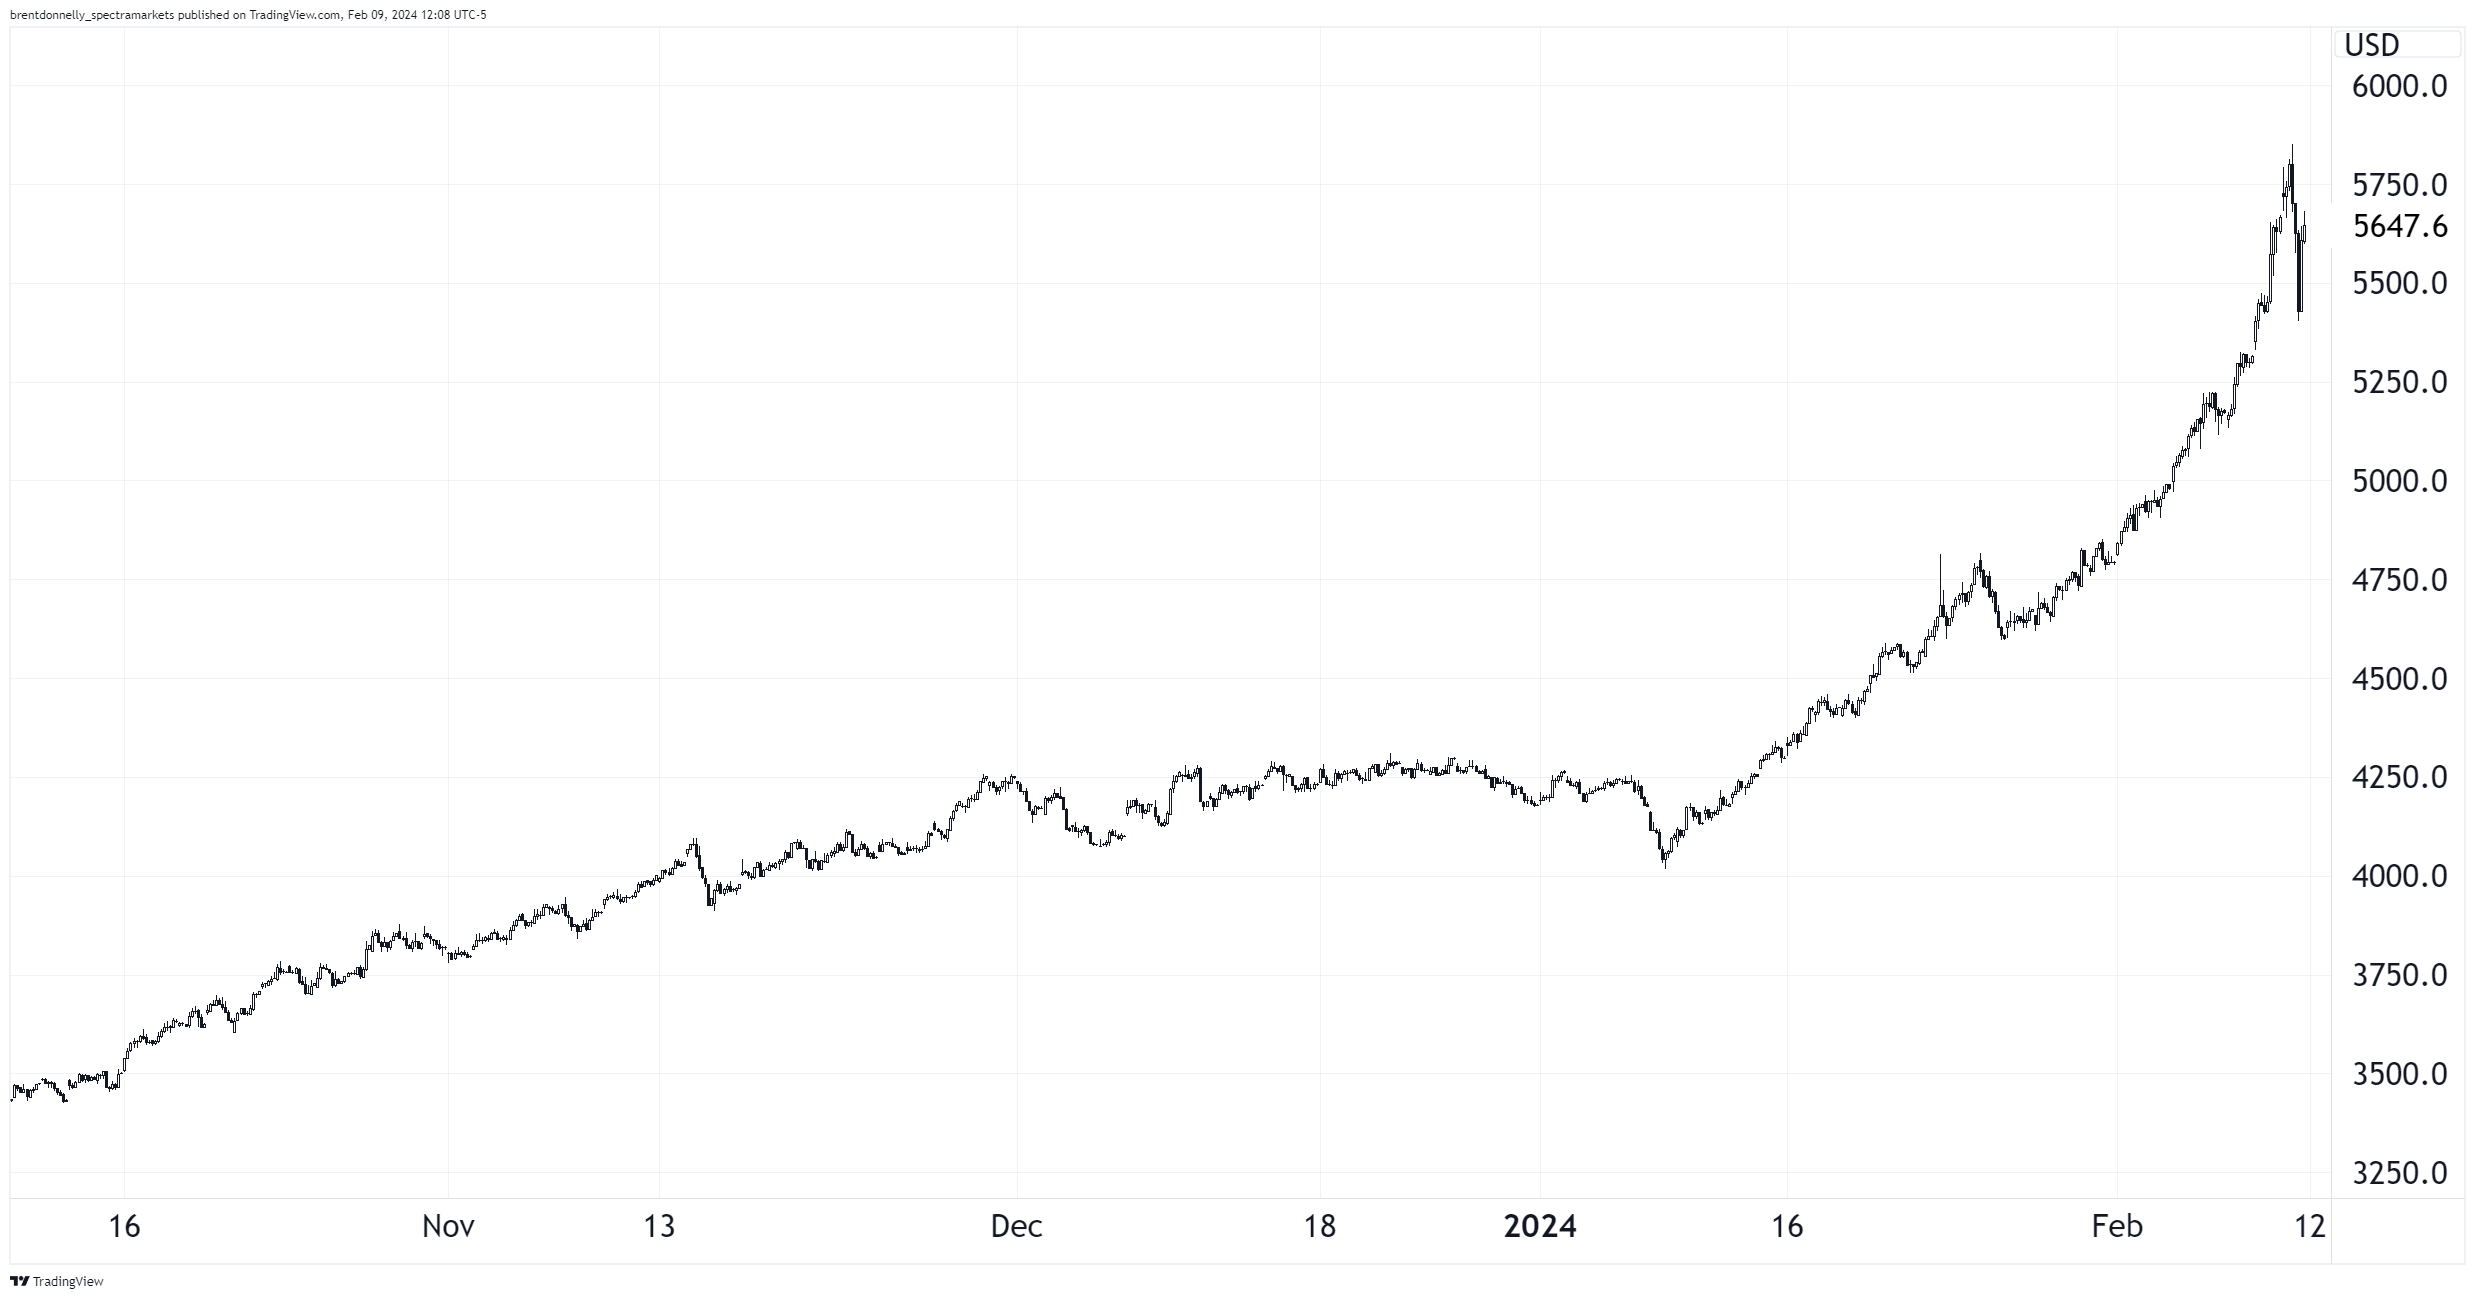
Shorting stuff like this is so much fun but also hazardous. Make sure you leave stop losses if you’re going to play something like this or NVDA or whatever.
“The market can stay irrational longer than you can stay solvent.”. JMK
OK! That was 7 minutes. Please share this newsletter with any aspiring finance professionals that you know. Thanks!
Get rich or have fun trying.
Links of the week
Interesting / smart
Short. Free. Must read imo.
https://brucemehlman.substack.com/?utm_source=substack&utm_campaign=publication_embed&utm_medium=web
Beautiful and inspirational (music)
Did you know Frances Cobain is married to Tony Hawk’s son Riley? They got married a while ago but I just learned it this week. Neat.

2009 banger to listen to in the car at 97mph
If you like house music, give this one a listen all the way through. Stupid silly auditory patterncandy that will tickle your brain’s tinglespot staring particularly around 5:00.
You can read the full background on why this song is so famous here.
