
It has been quite the year in macro as every single theme had a half-life measured in weeks.

Here’s what you need to know about markets and macro this week
Global Macro
It has been quite the year in macro as every single theme had a half-life measured in weeks and the consensus got hurt short the front end in March, and short the back end in November but also got hurt long bonds and long the front end at various times too! Recession gave way to growth. Society-disrupting levels of inflation gave way to Goldilocks disinflation and now everything is awesome and nobody believes anything is true.
While every major economic data point remains pegged in disinflationary boom territory, boogeymen lurk around every corner, every day. As discussed many times here and in am/FX, the soft data remains moribund even as the hard data stays mixed and the inflation story has improved dramatically.
Here’s a heatmap showing the evolution of the economic data since the start of COVID. It uses a 5-year (60 months) lookback to rank each data point relative to the 60 that came before it. So if you see “NFP: 43” that means that the current nonfarm payrolls figure ranks 43rd best out of the past 60 months.
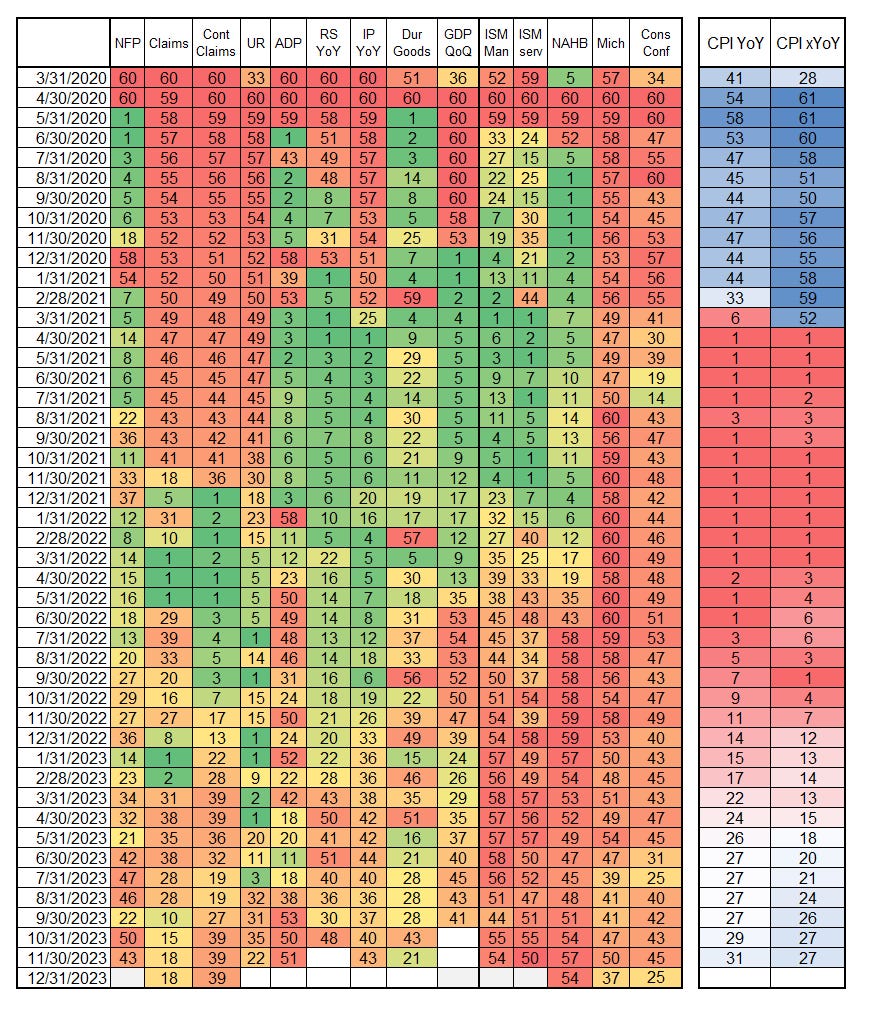
Some takeaways from this: Consumer sentiment has been horrendous and this is mostly related to high inflation. You can see that as the CPI figures improve, the consumer sentiment data is starting to improve, with a lag. Americans hate high food and gas prices and they love higher stock prices so one could probably continue to bet on rising consumer confidence from here as long as the jobs market remains strong.
The jobs market shows substantial cooling but it’s important to keep in mind that this heatmap is really showing you changes, not levels. Payroll growth of 200k jobs with an Unemployment Rate at 3.7% is great! It’s just not as great as the employment statistics during the post-COVID economic hypercycle.
I continue to believe that the sentiment and survey data have been broken by the polycrisis (inflation, political fragmentation, social media angst, deaths of despair, etc.) and they will improve but never get back to pre-COVID levels any time soon.
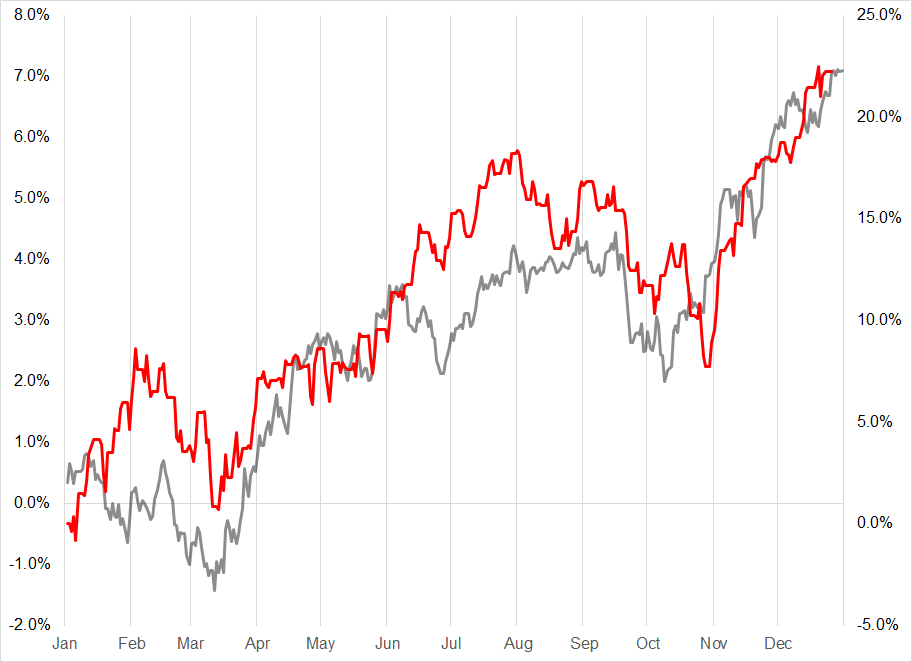
The disconnect between the NAHB Index (a survey of homebuilder sentiment) and XHB (the homebuilder ETF) continues to draw oohs and aahs from the crowd.
XHB (blue) vs. NAHB Homebuilder Sentiment Index (black)
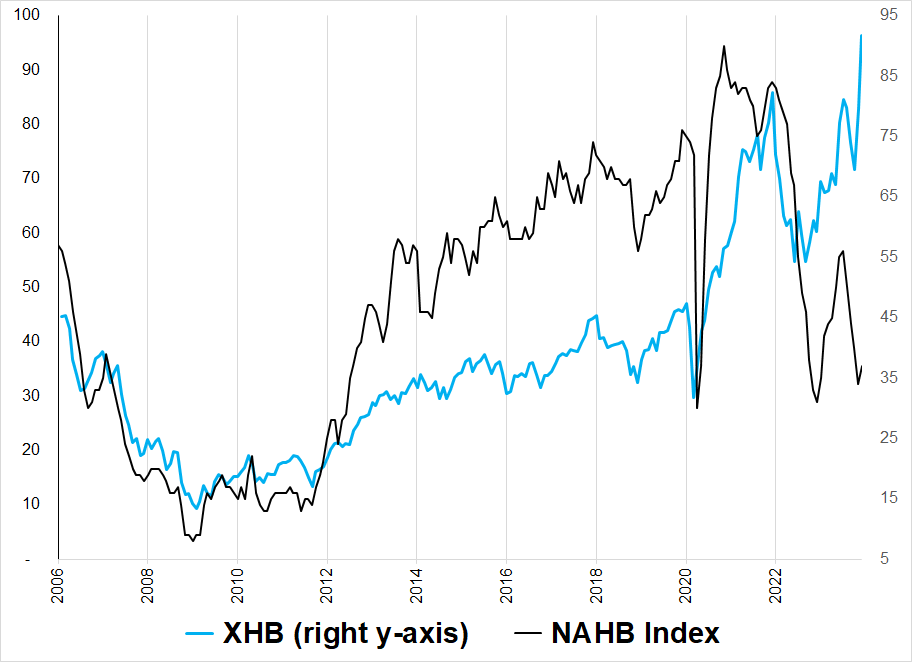
The crazy thing is now home prices are rising again and are likely to continue to rise as the Fed has turned dovish, there is a ton of trapped demand, jobs are still plentiful and buyers will soon get used to higher rates and start to pull the trigger again.
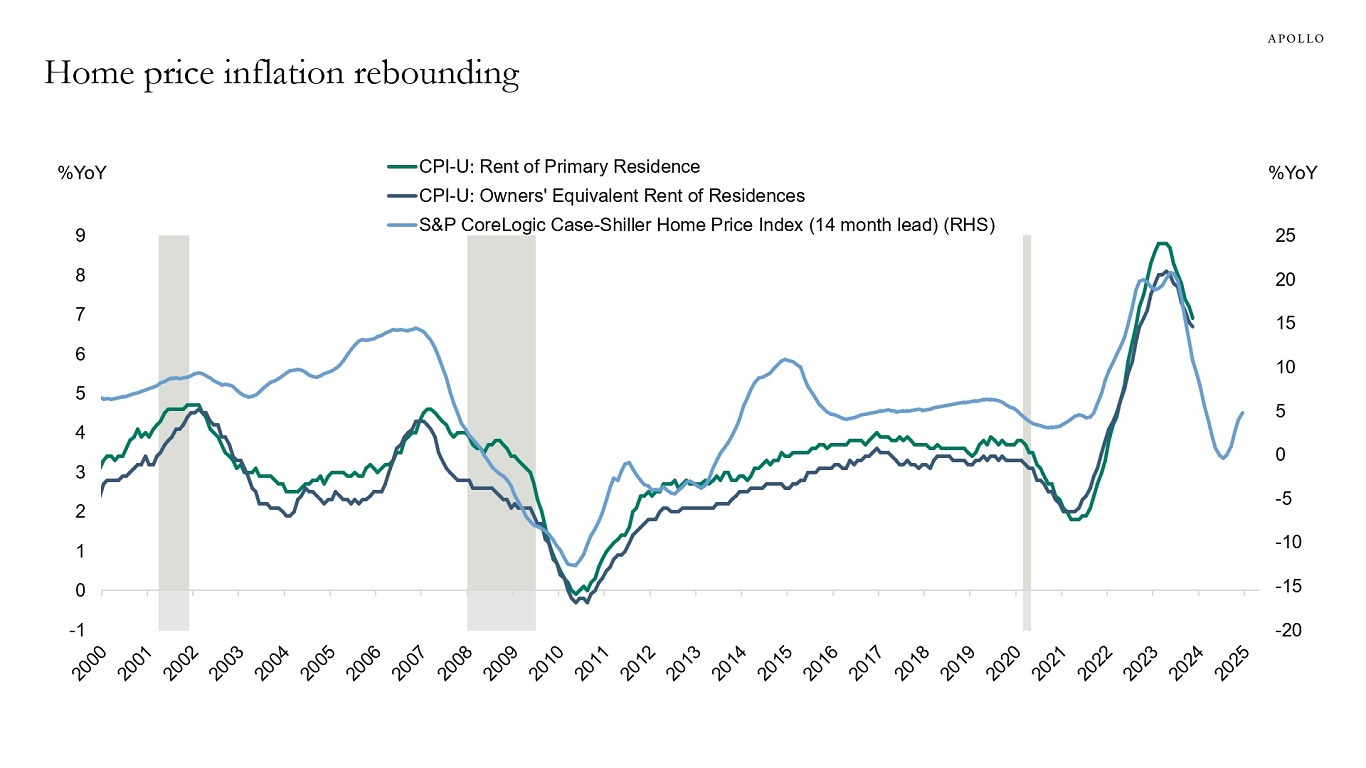
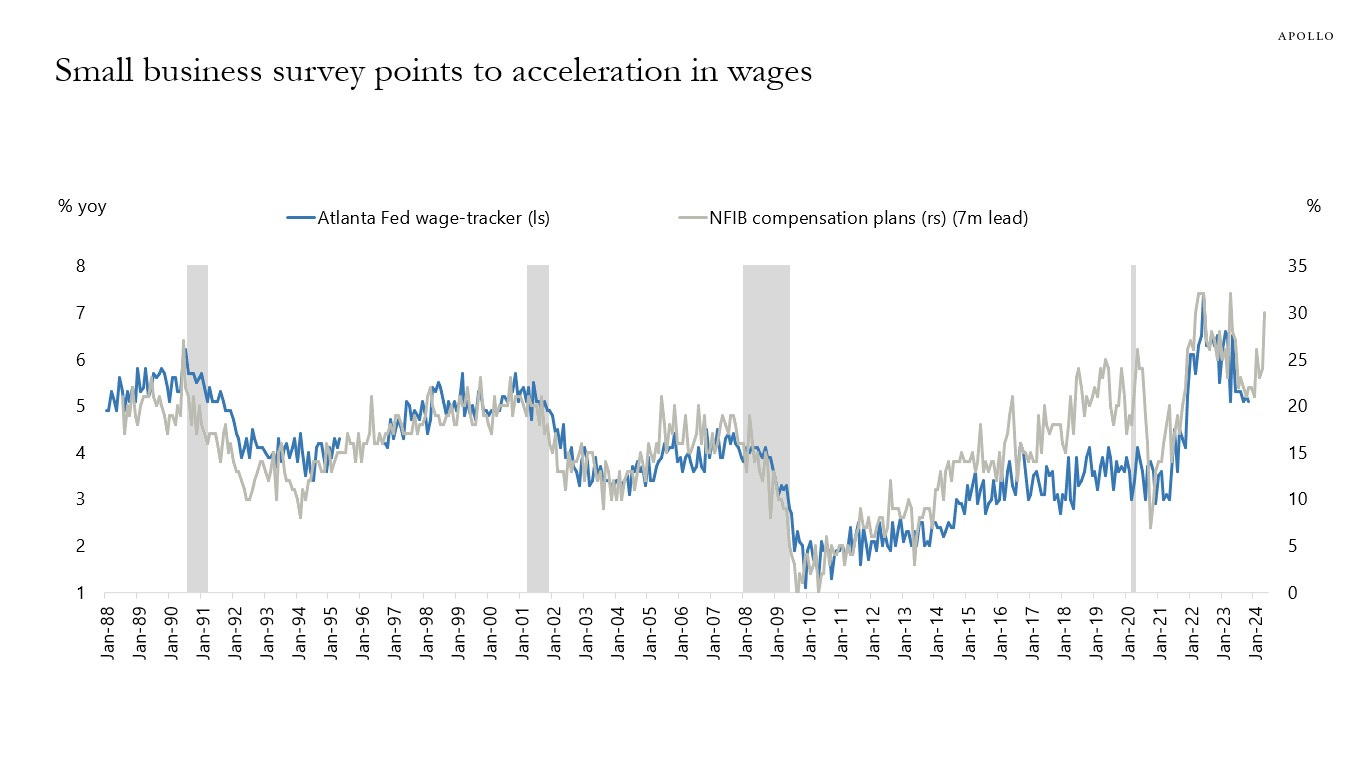
My thesis going into 2024 is that interest rate markets have overshot and the return of housing inflation and steady / rising wage growth will mean that the six cuts currently priced for the Fed moves towards something closer to 3 or 4.
Torsten Slok of Apollo has two good charts on the reacceleration idea. Here they are:
We shall see!
Stocks
One of the most amazing things about 2023 is how perfectly the SPX has followed the historical average seasonal path. Seasonality is probabilistic; it offers a clue as to where the weak side might be and what time of year flows tend to appear or disappear. It does not work every time, obviously.
People tend to have a strong recency bias with seasonality. It’s stupid if it doesn’t work: “Why did I follow that silly astrological signal!”, and then it becomes a must-follow after it works. “Wow, seasonality IS real. I should have followed it! I will follow it for sure this year!” So, my guess is that people will be overly focused on trading seasonality into 2024 due to recency bias (until it stops working).
This kind of thing is the reason this exists:
https://www.spectramarkets.com/product/2024-handbook/
To get out ahead of these patterns.
We are at such an interesting moment here in stocks as there has been a full-on buffalo stampede into SPY as you can see here.
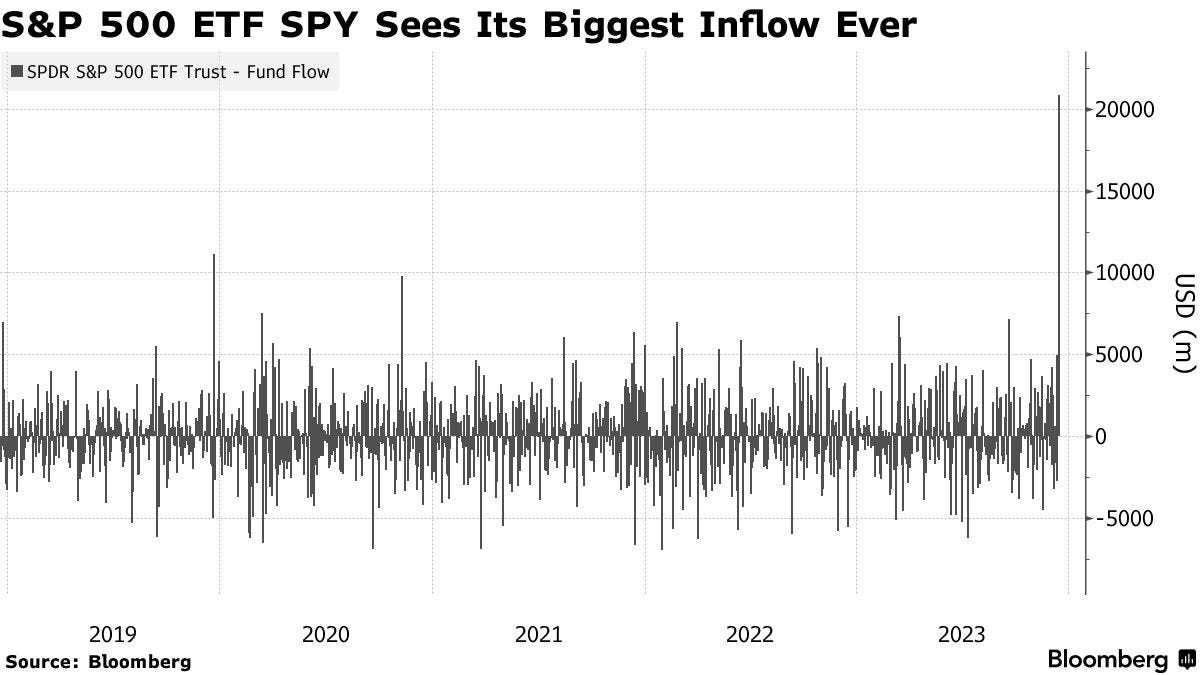
Sometimes buffalo stampede out into the wide open plains and live to keep running, and sometimes they go over cliffs as shown in this Smithsonian Institute diorama of the famed Buffalo jump where native Canadians and Americans would chase buffalo over cliffs to kill them in mass quantities.

I am concerned about the cliff aspect and as a trader, I would not be long stocks over the turn of the year. Selective shorts like NVDA could make sense as that stock continues to struggle into $500 and specs have gorged at the megatech and crypto buffet to the point where there is a risk that if they consume just one wafer-thin mint, they might explode.
Strong flow-driven trends very often turn at the turn of the year (as we saw at the 2022/2023 turn) and sentiment, positioning, seasonality, tactics, and timing all point to bearish risks for stocks over the next 4 weeks or so. The first 2 days of the year tend to be strong for stocks, then you get a period of soggy seasonality after that.
Here is this week’s 14-word stock market summary:
A perfect mirror image of the end of 2023. I like short or flat.
Interest Rates
Six interest rate cuts are priced in for 2024. That is an incredibly high bar and we get important data right away with ISM on 03JAN and NFP on 05JAN. I feel these events are skewed to a higher probability of higher bond yields and a higher USD as we could easily reprice to 4 cuts but it would be much harder to reprice to 8.
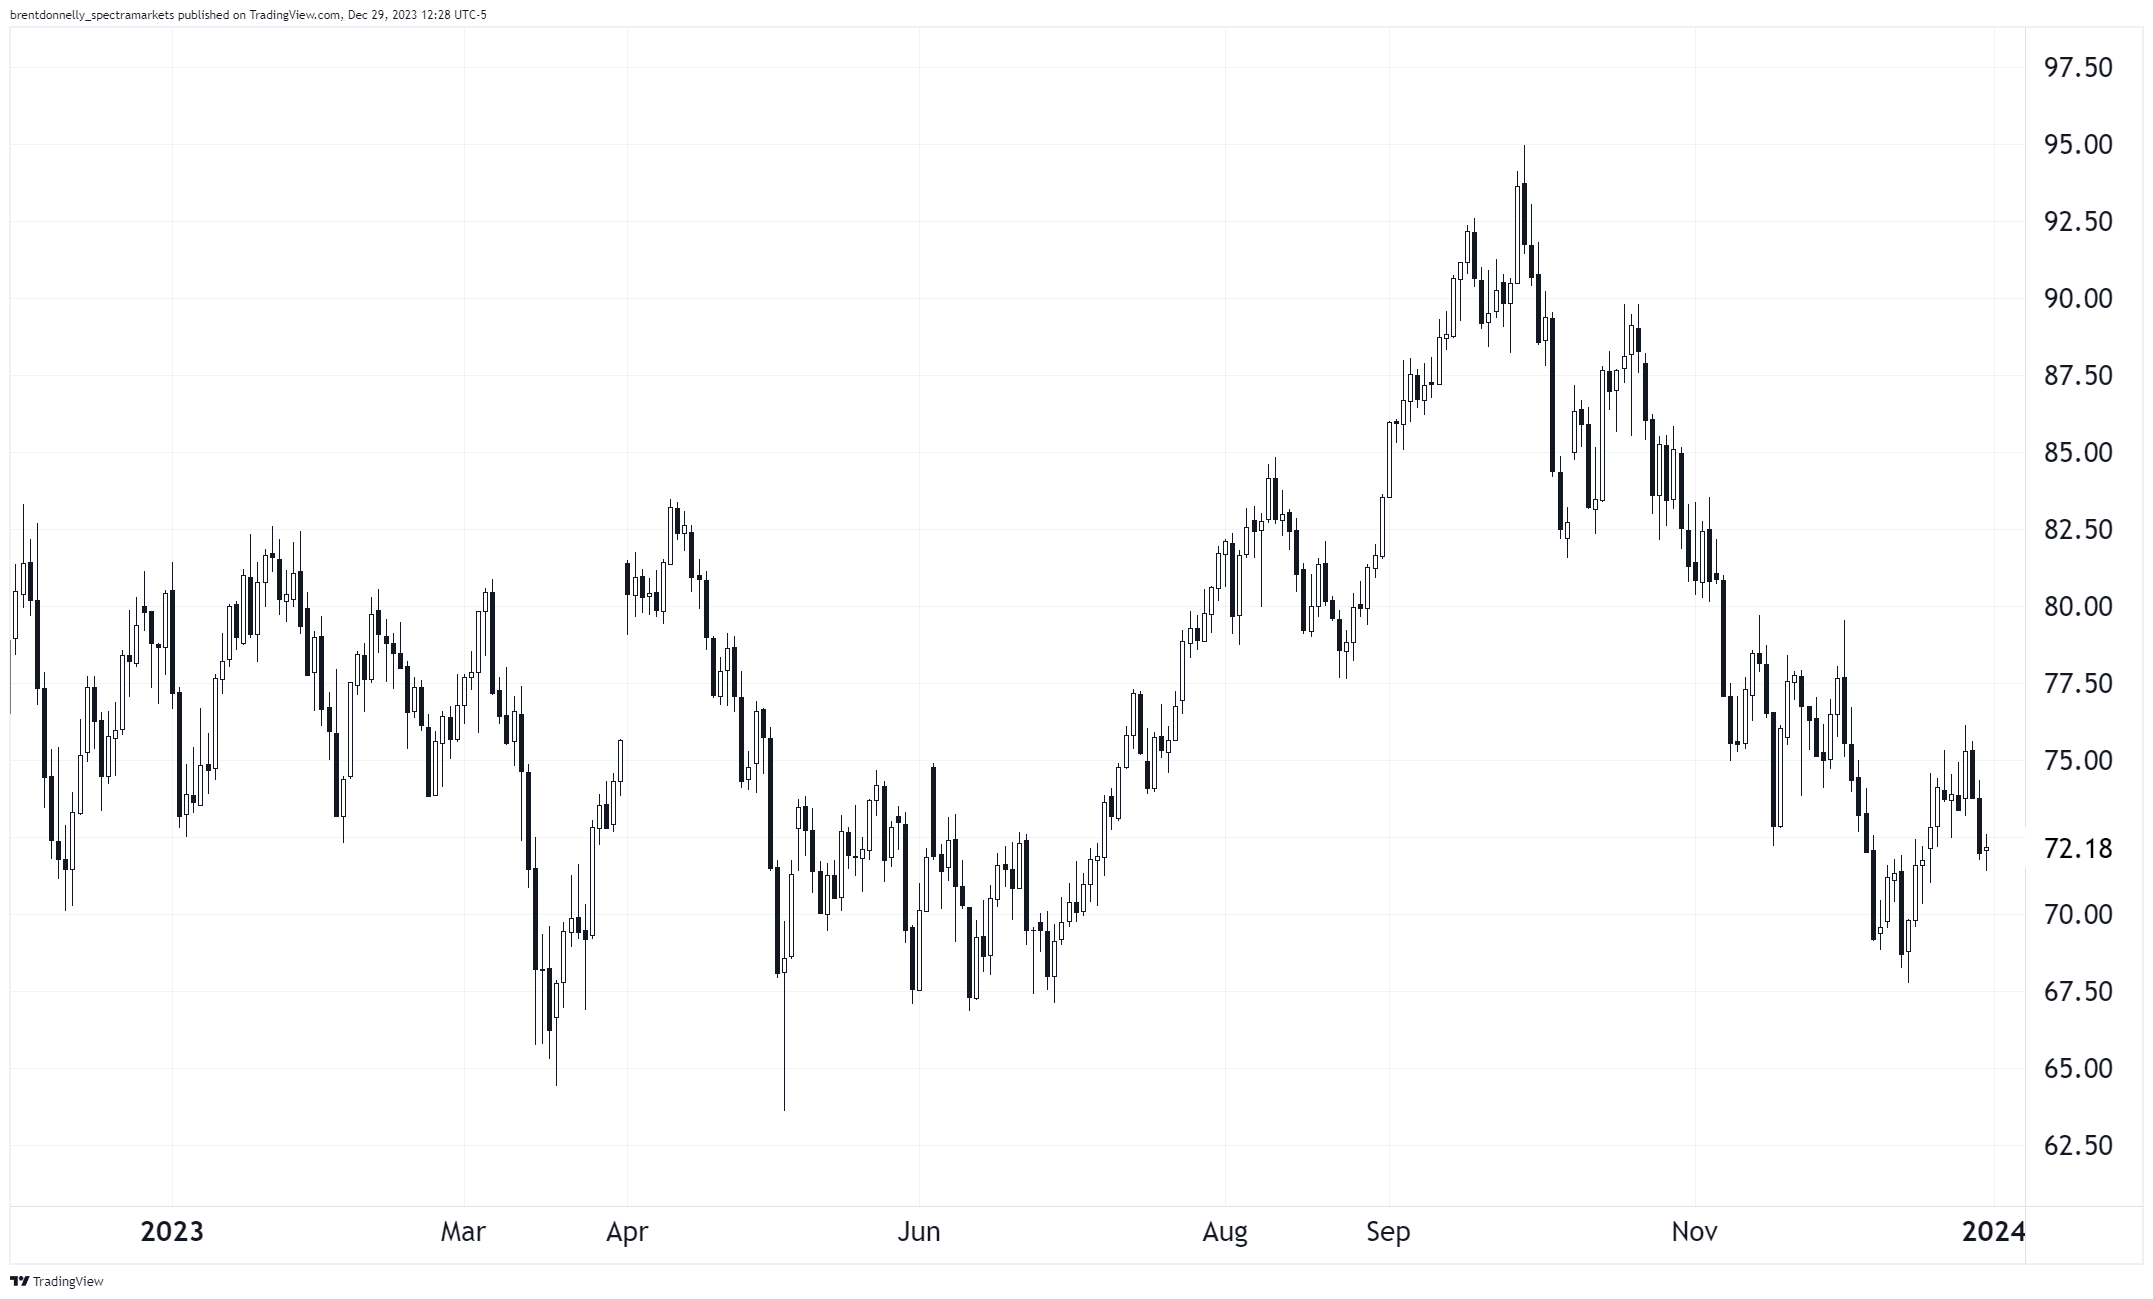
You can see in the next chart that US 10-year yields were unchanged this year, creating a candle of uncertainty sometimes call a doji. This is usually considered an exhaustion candle that precedes a reversal, but if you look at the four other times US10YY closed flat on the year, all four times, it then resumed its direction going into that year (i.e., it did not reverse, it continued 4 out of 4 times).
Yearly chart of US 10-year yield
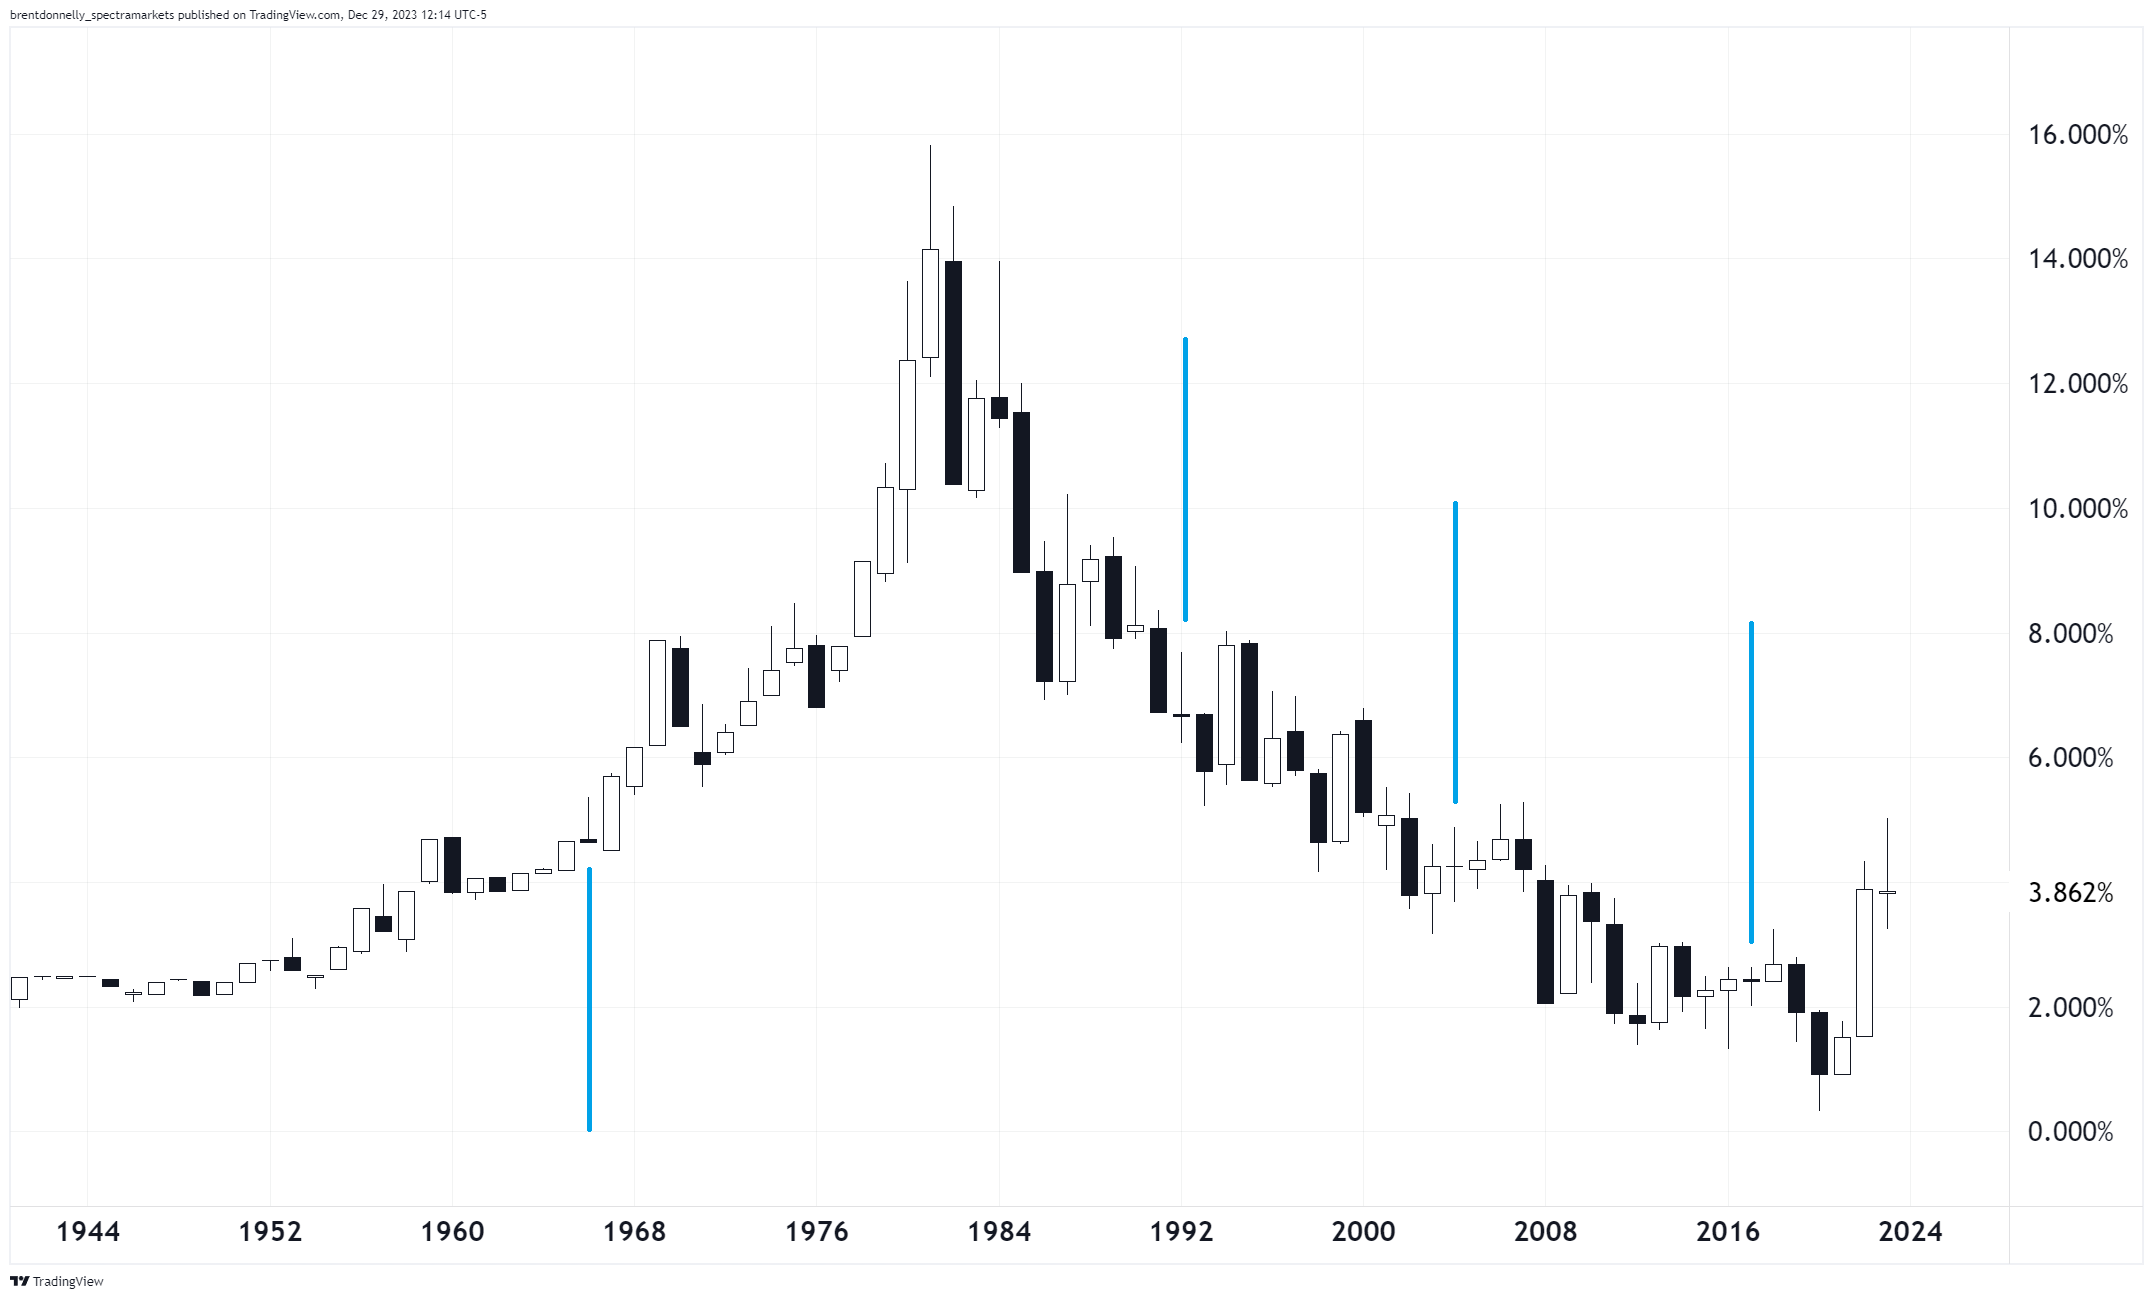
In the bigger picture, I think technology and demographics will continue to put downward pressure on inflation over time, as they did from 2010 to 2019, but my view in the short-term, to open the year, is that yields are much more likely to go up than down. By the end of 2024, I’d bet yields are lower, but I don’t trade that time frame and nobody can predict a complex system like the US economy and accurately forecast where it’s going to be twelve months out.
Fiat Currencies
The dollar is soft as the Fed pivot emboldens bears and year-end flows and seasonality dominate. Those flows are done now, and I think the Fed pivot is overpriced short-term, so guess what I think the USD is going to do?
For a detailed discussion of the relationship between the USD and US yields (particularly USDJPY), please see this free edition of am/FX:
am/FX: If it was easy, it wouldn’t pay so well
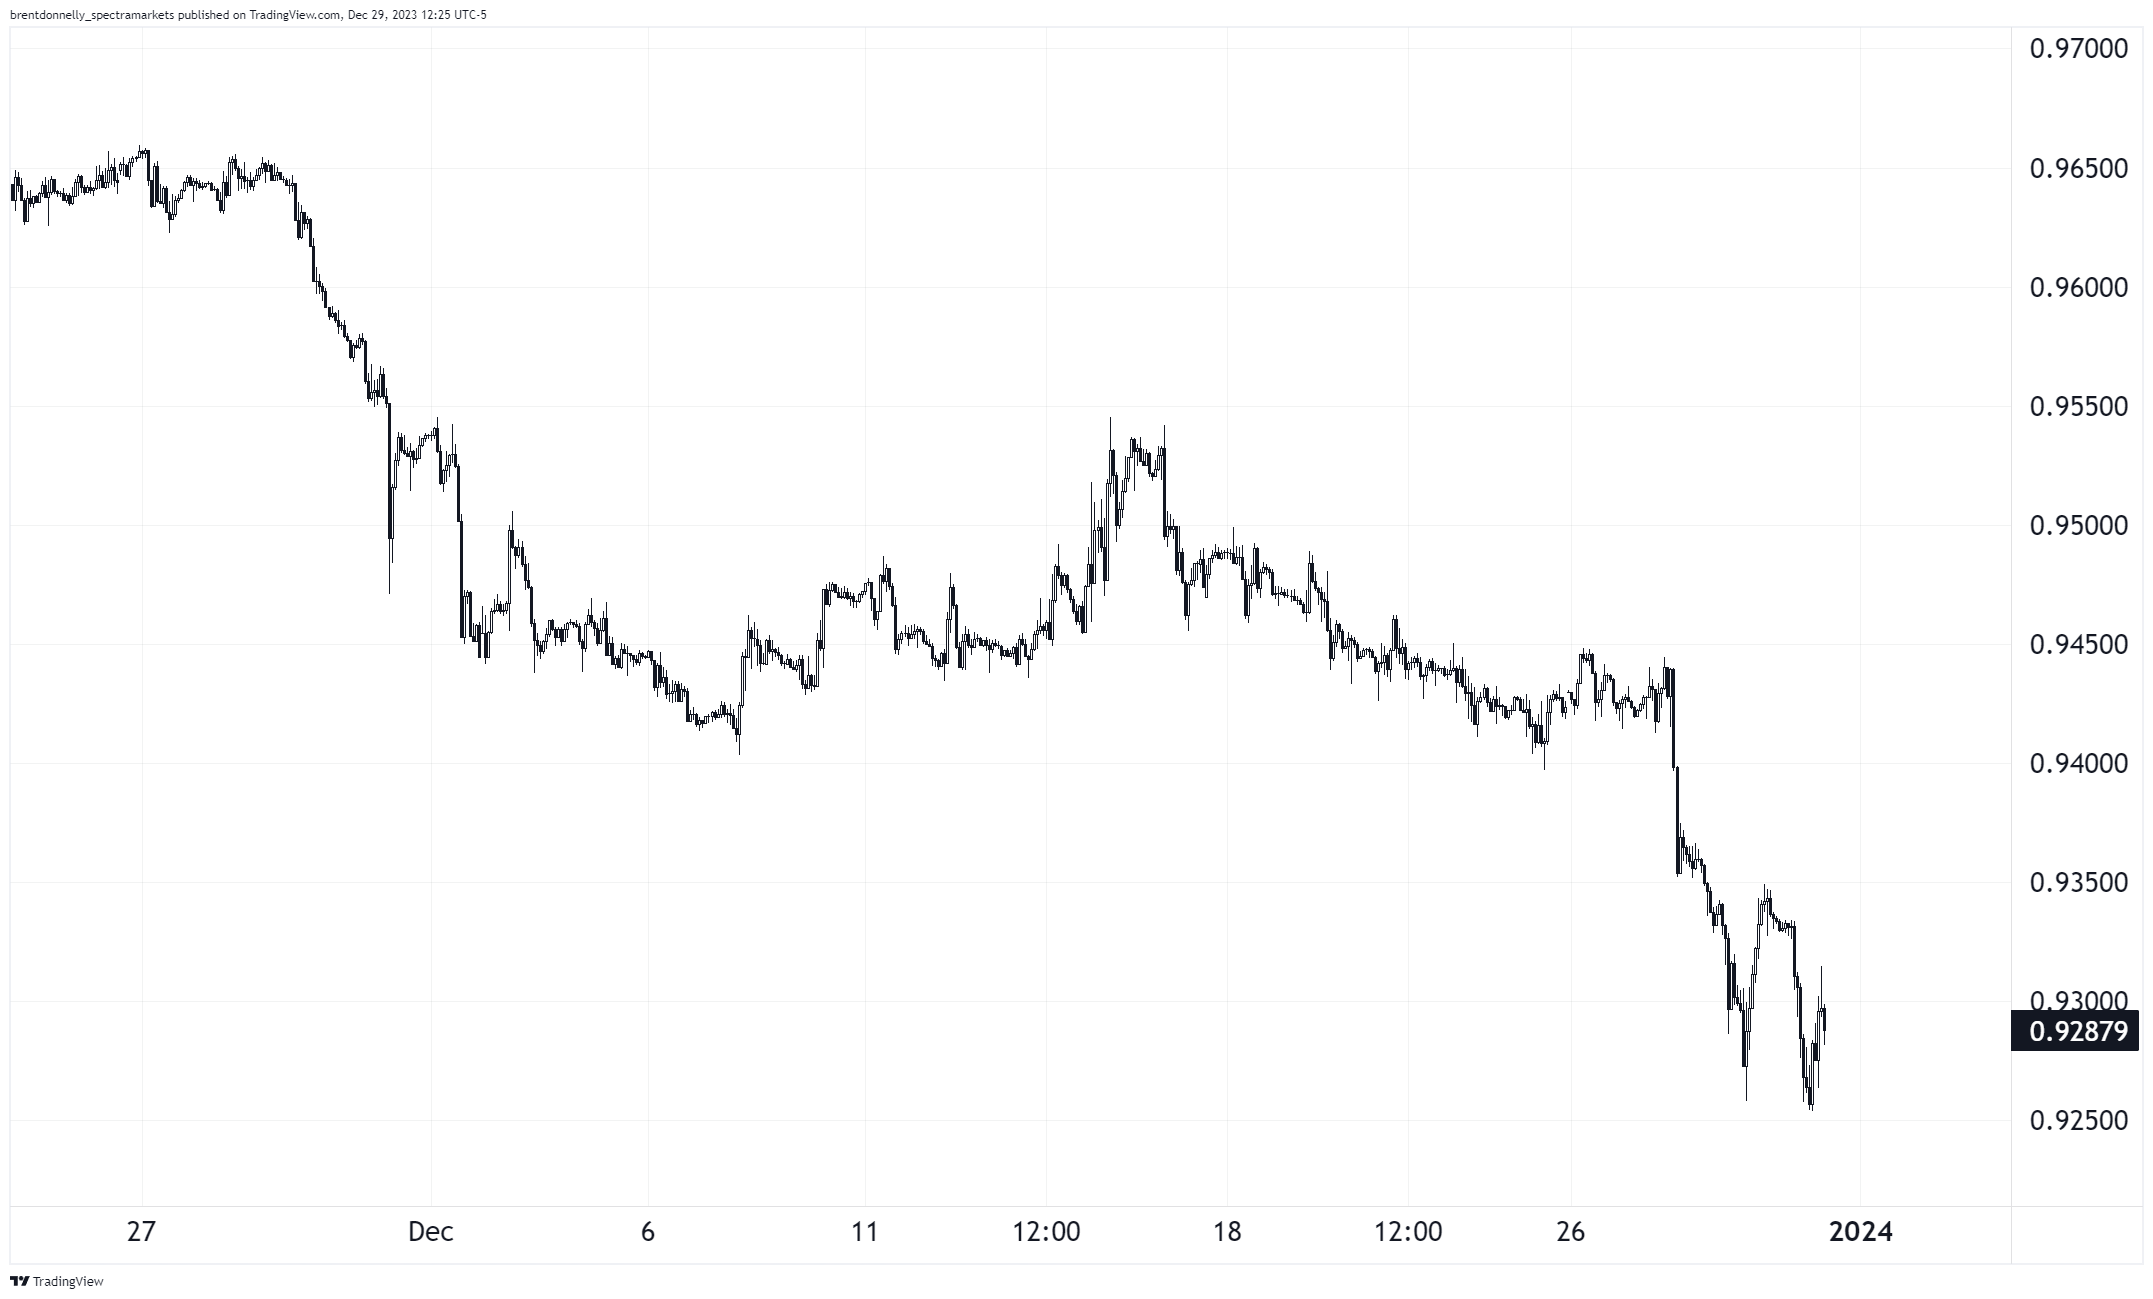
The USDJPY chart is narrowing as it falls from 150 to here, and you can see the 200-hour moving averages have defined the trend perfectly all the way down.
USDJPY hourly with 200-hour MAs and trendline
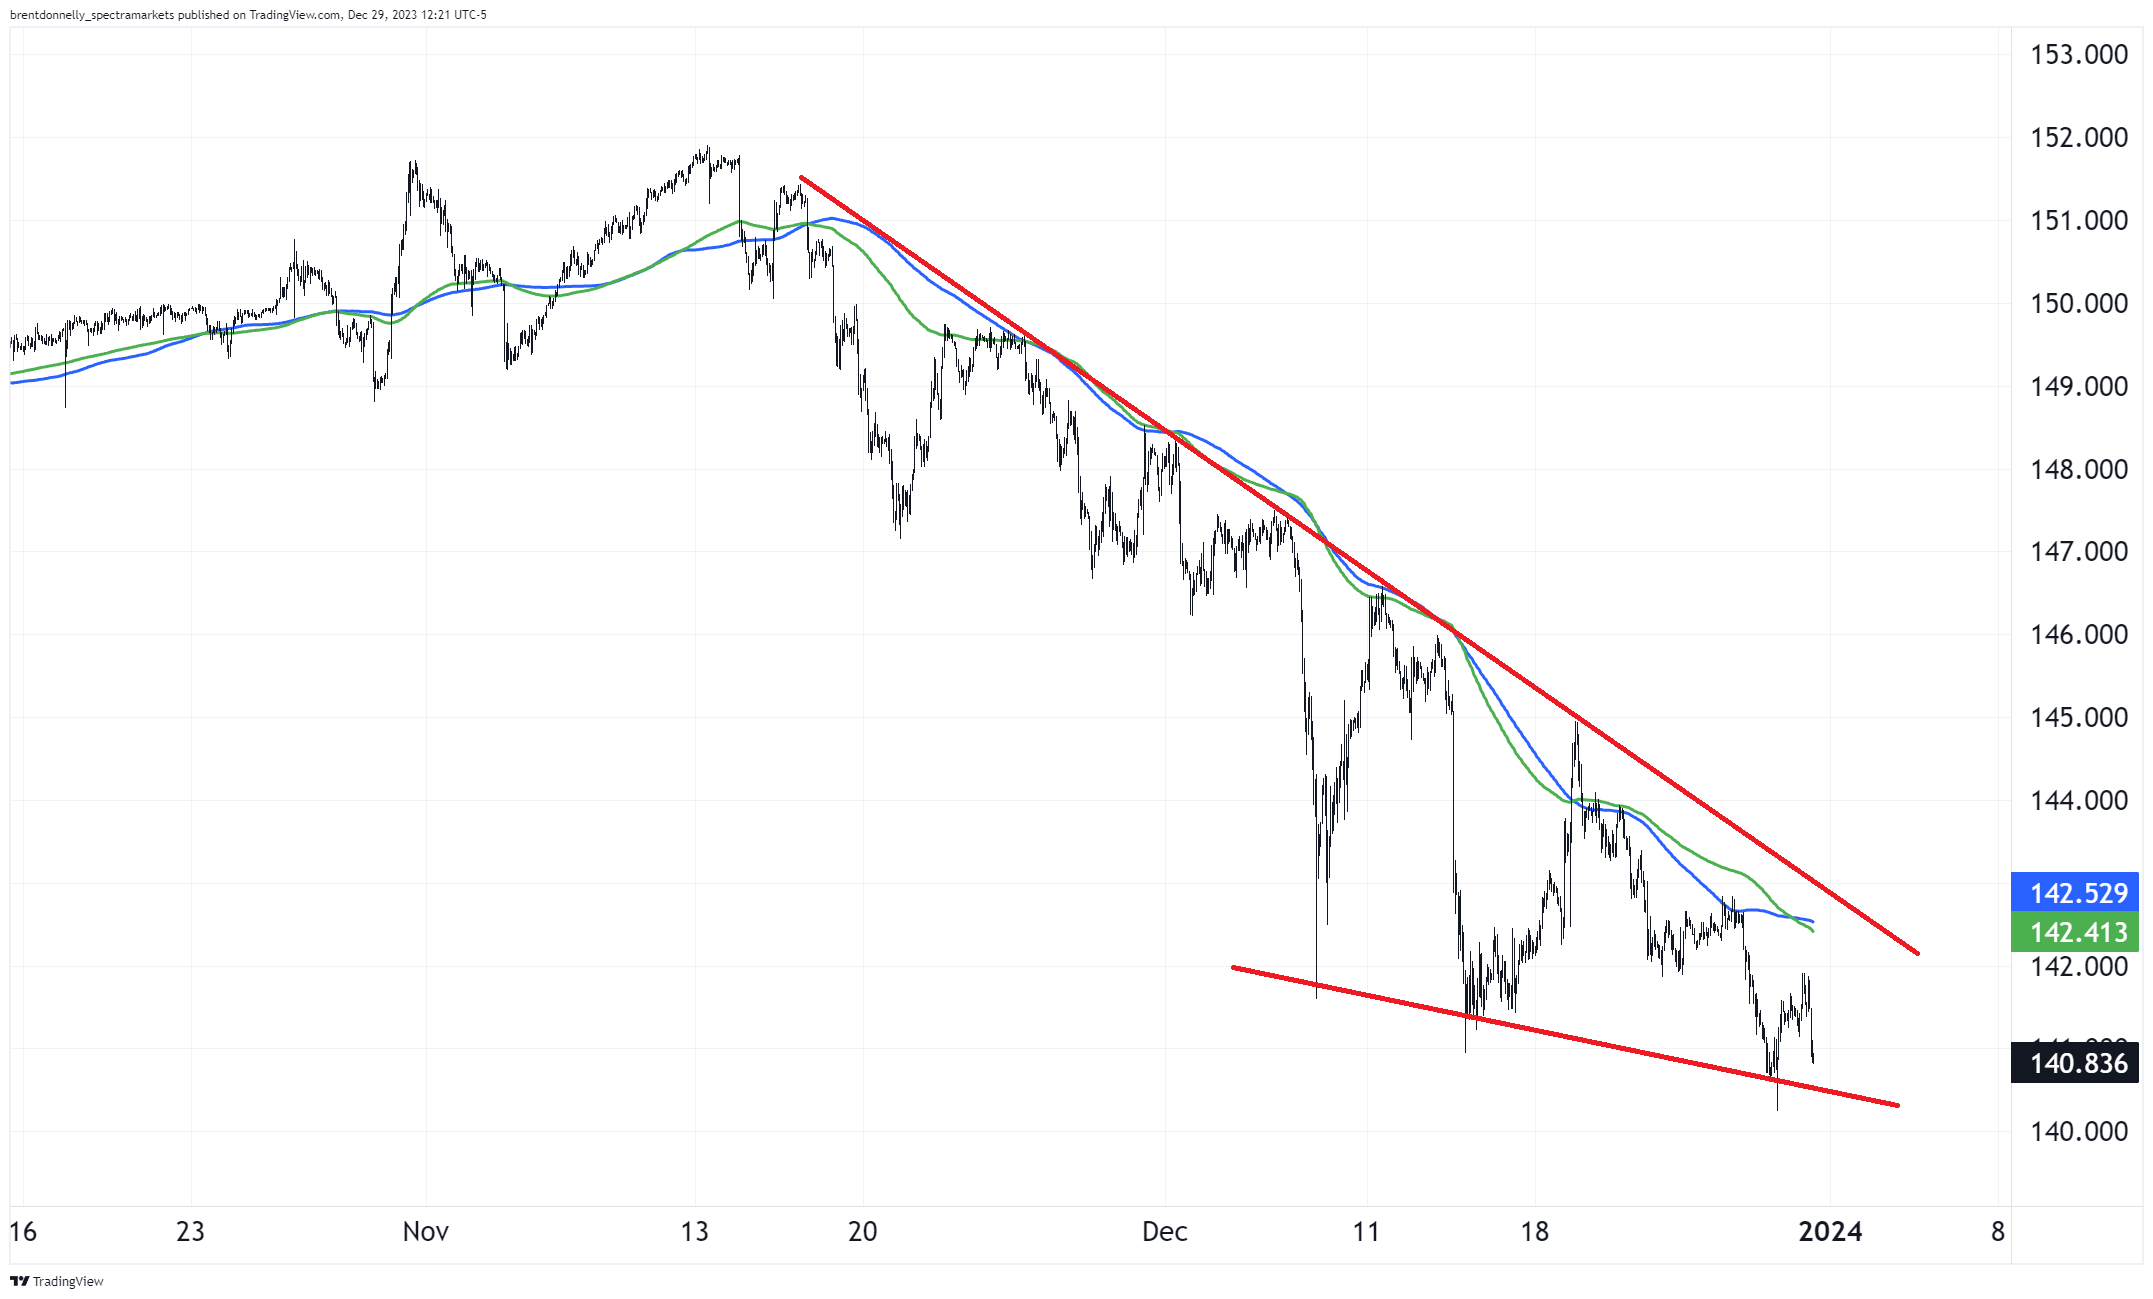
A break below 140 is bad for my bullish view, while an hourly close above 143 is fantastic news for USDJPY bulls.
The CHF has gone mad this week, again on year-end flows, and I like shorting CHF as there should be some mean reversion in the first few weeks of 2024 and the SNB is likely to get annoyed with the disinflationary pressure implied by a raging franc.
EURCHF hourly chart in December
Crypto
The period from midnight on 01JAN to 05JAN is going to be super fraught for BTC and crypto as winners can sell in the new tax year and the “who’s gonna sell first?” game begins ahead of the widely-expected buy the rumor / sell the fact trade post-ETF approval.
The EV of owning crypto in the first week of the year is almost certainly negative.
The reaction in the week or so after the spot ETF announcements will tell you everything you need to know for a while. Will there be anyone left to buy the dip? Long-term this 1-week period has no relevance, obviously. These are trading not investing thoughts.
Twice a year, I update this sheet. The evolution of The Crypto Hot 15 according to coinmarketcap. Notable changes: TON makes its first appearance. SOL number 5 with a bullet. AVAX like LL COOL J.
I know crypto market cap is a sus concept but whatever.
Commodities
Oil is in a range. Gold is trying SO hard to regain its footing. Silver is sad to look at. Crude has had so many narratives this year and yet it’s unchanged on the year and gasoline prices are no longer front of mind.
NYMEX Crude Oil, Daily Chart for 2023
OK! That was 6 minutes. Please share this newsletter with any aspiring finance professionals that you know! Thanks!
Get rich or have fun trying.
Links of the week
Instead of links this week, here’s a poem I wrote about global macro and financial markets this year. I appreciate you taking 5 to 8 minutes out of each of your Fridays to join my stream of consciousness. May your profits be embarrassingly large in 2024.
2023: Rearview Mirror
2023 had ~23 themes
Each briefly in our brain like 23 dreams
Each narrative not as good as it seems
Bonds down / bonds up / convexity extreme
Everybody buy high / sell low / revert to the mean
Higher for longer gave the bond shorts thrills
Then they all got crushed cuz Yellen ♥ bills
Yellen likes bills and the dots like cuts
Fed playing poker
Flip the cards
Got the nuts
China reopened but China stocks red
Xi’s got no stimmies China housing still dead
Demographics short Pampers© and long Depends™
Balance sheet recession like this never ends
Regional banks die / VCs panic on twitter
Oil down, USD mixed, gold’s got the glitter
Every single month we got a new surprise
Every single month we gonna dedollarize
Dollar’s always dead but it never did die
SPX, megatech all time high
AI, AGI, GPT3, boom
MAG7 to the moon just like p(doom)
SBF is guilty / crypto’s dead
Crypto falling down like the economist said
Oh whoops winter’s over now it’s summer instead
Solana too sexy for Milan again Right Said Fred
60/40’s back like Lazarus woke from the dead
FCI on the fly risk parity spoke in class (hey)
and the shorts bleed red
Nvidia hysteria
30X sales ain’t scarin’ ya
YC inverted, but nobody caring yea
Carry trade pumping loud like stereos blaring yea
Number one carry is short dollar / long Mexico
Peso been like fire pour on gasoline from Texaco
Housing en fuego too / XHB moonshot
The Economist said housing was doomed too but ermmm… it’s not
Logic said sell / magazine cover capital bought
Get rich or die trying cuz you gotta have fun
Write / trade / laugh / pray/ I’m too old to die young
I rap like Kendrick, I mean Anna, not the other one
So that’s me, MBD, driving across the border of ‘23
in a blacked out M3
blasting Prodigy
Sometimes I’m wrong / Sometimes I’m right
But I always write feverishly
I write like I’m running out of time that’s just me
I talk FX spot and Fed dot plots and take my shots and
sometimes…
…thoughts arrive like butterflies
Win or lose, tomorrow the sun will rise
“The End of ‘22” by Max Capitulation
We’re all bulls now / smells like extrapolation
Maybe just cynical I’m bullish at the highs desperation?
Anyway, that’s it, thanks for everything
I’m out the door
Lucky ‘24.
