friday speedrun

Inflation is a falling maple seed

While core inflation continues its slow descent, headline has been sticky, but should be set to fall now as oil, gasoline, lumber, and used car prices fall.

Hello. It’s Friday. Thanks for signing up. I’m Brent Donnelly.

The About Page for Friday Speedrun is here.


Here’s what you need to know about markets and macro this week


Global Macro

The most important CPI release since Christopher Columbus “discovered” North America delivered a happy outcome as inflation continues to drift lower. Inflation does not fall like a rock; it falls like one of those awesome helicoptering maple seeds in fall.

The falling maple seed takes a long time to get to the ground, but it generally gets there, even if gusty winds and updrafts might push it temporarily up on the way down. While core inflation continues its slow descent, headline has been sticky, but should be set to fall now as oil, gasoline, lumber, and used car prices fall. Here, for example, is the price that most impacts American inflationary psychology: The price to fill up your Ford F-150.

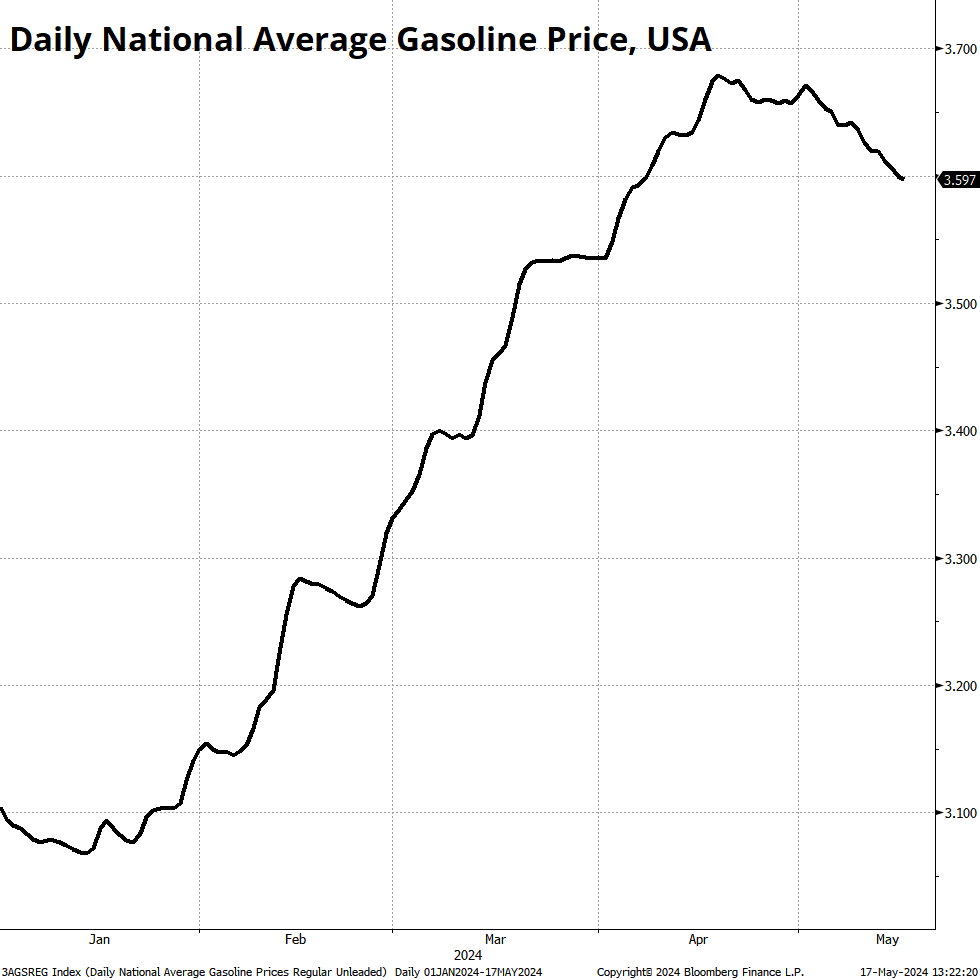
It is not written in the stars that gas prices will continue to go lower, but we are more than halfway through May, so it’s increasingly written in the stars that the energy contribution to CPI this month will be negative. Still, with 25 or 55 different inflation series to choose from, one can easily argue that inflation is still a huge problem, or that inflation has been completely vanquished. The truth is somewhere in the middle.

The weakening US data has been a theme for a few weeks now, and we got more whiffy hard data as housing and Retail Sales missed expectations this week. The market has now fully embraced the idea that US economic data is no longer pinned to the red line, but the jury is out as to whether this is a mini soft patch or the start of something more nefarious.

One of the big economic data analysis issues of the current millennium is that there are simply way too many data points to look at. This leads to a huge confirmation bias problem because if the mainstream economic data isn’t supporting your worldview, you can simply look under the hood at more designer indicators and utter smart-sounding platitudes like:

The devil is in the details.

That’s why I like this chart from Macro Alf. It takes the average of 24 job market indicators in the USA to avoid the cherry-picking problem, and compares them to the unemployment rate.

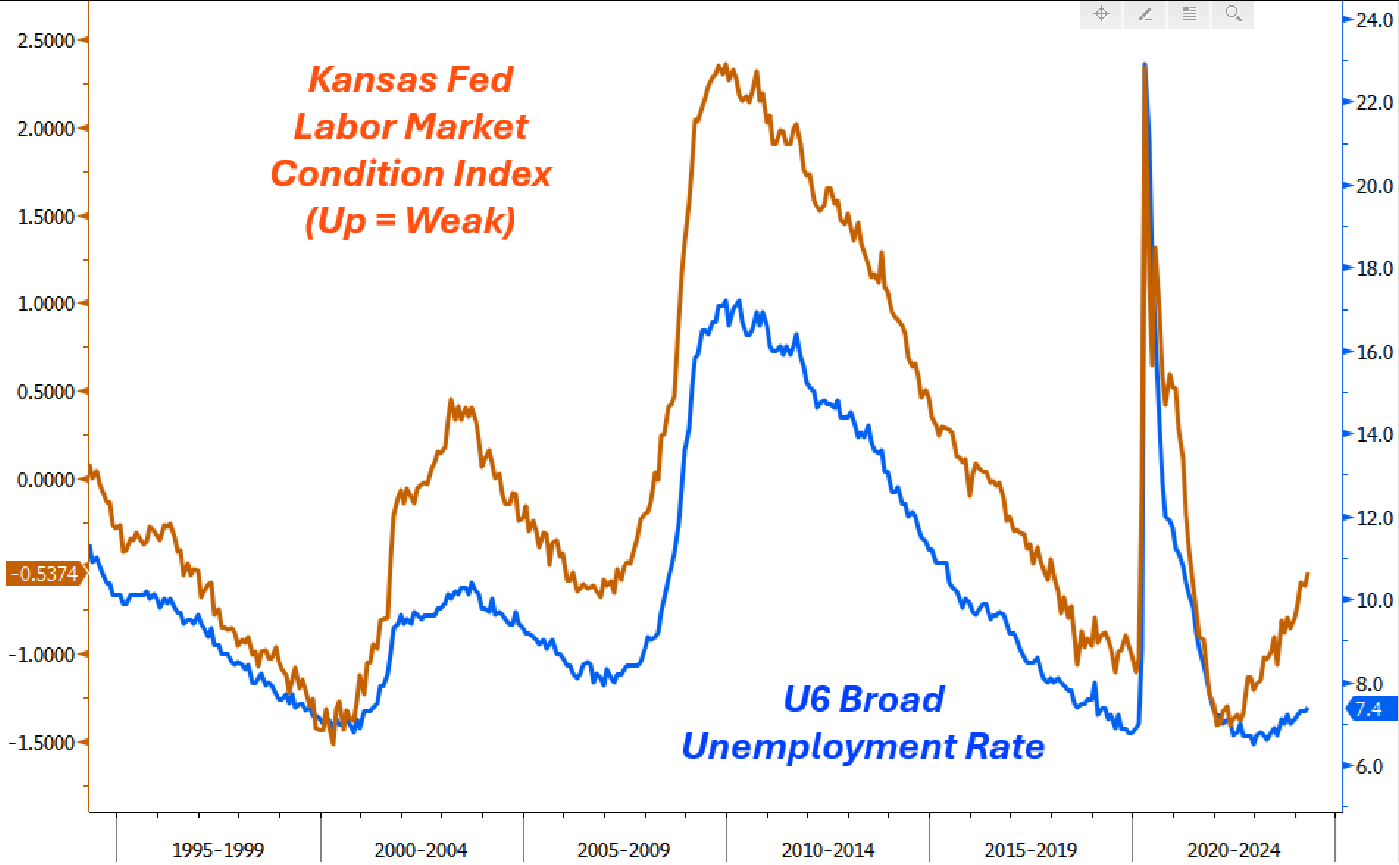
The more broadly cited unemployment rate (U3) is currently at 3.9% and looks like it’s headed to the 4.2%/4.4% area soon. That will be enough to trigger the Sahm Rule and ratchet up recession fears and US rate cut hopes.

Alf and I talk much more about that chart in this week’s podcast. The podcast is not Roganesque. It’s always just ~35 minutes long.

Outside the US, the market keeps looking for a dovish Bank of England and more rate cuts from the ECB, but those stories are getting stale, and it’s been very difficult to price in more than three cuts for the ECB. While Lagarde et amis have promised a June 6 cut, any cuts after that are going to depend on the data.

Finally, China announced a partial bailout for their residential property sector and opinions vary on whether or not it matters. Some say it’s exactly the right way to assist in a balance sheet recession while others say it’s small potatoes and could serve to exacerbate Chinese real estate woes by buying homes below market and forcing prices even lower. There is no coherent narrative on China, just a bunch of divergent opinions.


Stocks

Stocks are in wood chopper mode as softer US data takes the pressure off the Fed and puts us back into the Goldilocks regime where you can say “solid nominal growth” and “The Fed is gonna cut” in the same sentence without sounding bananas. Fed interest rate cuts in a solid economy are what equity bull dreams are made of.

The three major US indices made new all-time highs this week with the SPX, DJIA, and NASDAQ all touching levels not seen since ever. While sentiment is overwhelmingly bullish, that’s always the case during bull markets.

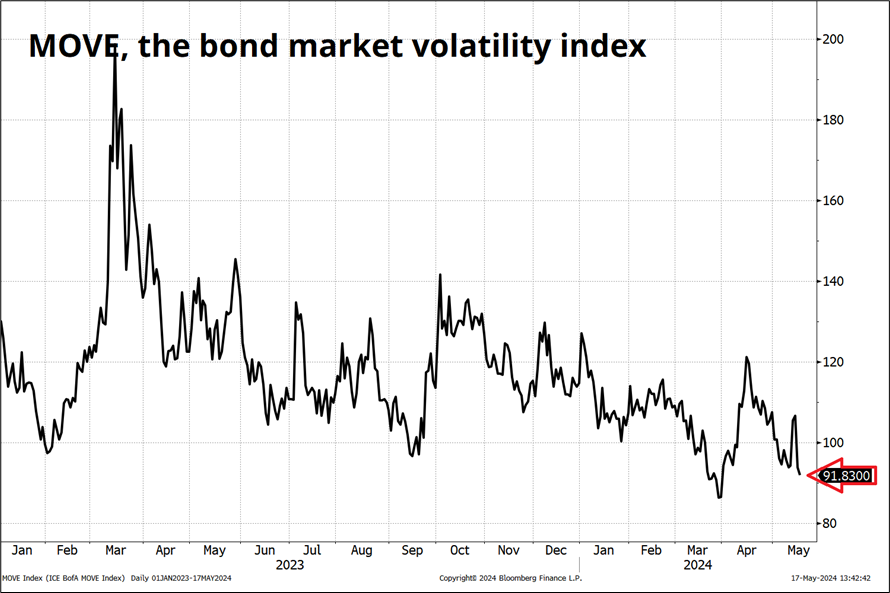
Stocks are said to climb a wall of worry, but strangely I don’t even know what to worry about right now? Recession? Maybe, I guess? Overheating? Nope. Middle East? Not really. Corporate earnings? Nope. Bond market volatility? No sir/madam.

You need to think outside of the range of economic soft patch to mild acceleration before there is a plausible equity-negative scenario and we look to be firmly ensconced in that Goldilocks area. The barnburner would be if the US data rolls over, hard and we are already in recession. Doubtful, but let’s see.

Speaking of equity positioning, I thought this chart from BofA (via Twitter) was interesting. It is a useful reminder that things can trend, and positioning can remain elevated for long periods. This is especially true with bullish equity sentiment because stocks trend higher for longer than most other asset classes.

In FX, some currencies are good to trade contra to sentiment and positioning (GBP and CAD) while others backtest better if you go with the trend, sentiment, and positioning (USDJPY). This is true across asset classes too. The takeaway is that when you see extreme long positioning, have a think and backtest whether that condition is bullish or bearish for the particular currency, security, or asset class. It can be either. Or neither.

Here is this week’s 14-word stock market summary:

Bears despise when the market flies, but the all-time highs are often buys.


Interest Rates

The softening of the data and the lower inflation impact of commodities has been a theme I’ve been pounding on since the start of May, but I think it’s pretty mainstream and priced in now. We were in an overshoot zone entering May, and now yields look much more reasonable. The Fed capping the distribution and a run of weakish data have knocked yields back away from the scary 5% area and now it’s really up to the data to decide from here.

That said, the second half of the month tends to feature much less data than the first, so we may have to be patient and continue to row through the low-vol swamp of nothingness before we can engage more fully in some sort of new and interesting macro narrative. Dramatically weaker data in June would be the start of a deeper drop in yields. Right now I don’t see it.

Here’s the calendar for next week.


Fiat Currencies

The USD is on its heels, in a low vol way, and the market has been moving towards a more dollar-bearish vibe. Expectations for a move are somewhat tempered because short dollars is rather negative carry, even as the negative carry contracts.

The best example of this is to compare USDJPY to the spread between US and Japanese yields.

You can see there is a bit of a wedge between yields and USDJPY (i.e., USDJPY looks a tiny bit high). This is down to the very low levels of volatility. When systematic carry strategies evaluate the desirability of carry trades, they compare volatility to carry. As volatility falls, a lower carry becomes acceptable. Think about if you can earn 4.4% on a thing that moves 1% per year—that’s super attractive. If you can earn 4.4% on a thing that moves 40% per year, that’s much less attractive because capital losses are more likely to wipe out the carry.

With USDJPY volatility on the low to very low side, the big carry offered by long USDJPY makes it harder for USDJPY to go down.

The most popular carry trade of the past 18 months has been the Mexican peso, and that currency is ripping again as vol crumbles and Fed cuts come back on the radar. If there is a meaningful turn weaker in the US labor market, MXN will become less attractive as remittances from Mexicans working in the US decline. But for now, we’re in whatever the Spanish word is for Goldilocks.


Crypto

Crypto is zipping higher late this week as we are back in “everything rally” mode. You could argue the moves in the coin and token market have been on the disappointing side as TradFi is making new all-time highs while the actuals vs. ATH in crypto look like this:

You can see large cap outperforming small cap across the board. I put WIF and JEO in there, but I think comparing BTC to ETH to DOGE in declining order of blue-chippitude makes sense and you can see BTC 1, ETH 2, DOGE a distant third.

Just like the Russell 2k and silver, the baby brothers are underperforming the big boys. Mildly interesting.


Commodities

Silver is stealing the show this week as it rips through the $30 resistance that held fast even when the WSB crew attacked it in February 2021. I have a funny memory of that day because I worked at HSBC, a bank that is huge in gold and silver and I am good friends with Corbi, the gold trader there. I got early wind that Wall Street Bets was pumping silver and so I ran over to him and said, in a voice as serious as a heart attack:

“Dude. You see this??? Wall Street Bets in silver.”

He looked at me, nodded, and I ran back to my desk because the shit was massively hitting the fan in those days as COVID was still rocking the FX markets and I was a market maker.

At the end of the day, Corbi walked over to me and said:

“Dude, when you came over here this morning… That was the most Wall Street moment ever.”

And we LOL’d. Blue Horseshoe loves Anacott Steel type of thing.


OK! That was 6.74 minutes.

Get rich or have fun trying.


Links of the week

Join the waitlist for Spectra School. Let’s go! Improve your thinking and learn the right frameworks for trading and investing. The stuff you don’t learn in college. Launching soon. https://www.spectramarkets.com/school/

Smart, interesting, or funny

  1. SNL hilarity

It’s rare that someone on SNL breaks. But it does happen!

  1. Are Barron’s covers a contrarian indicator?
  1. Suno, the horrible and uncanny and superfun AI song maker machine
    1. A song I made about Microsoft Excel
    2. A song I didn’t make about the first 50 decimals of pi
  1. Is it a media outlet or a hedge fund?

Interesting behind the scenes look at Hunterbook.

Music

One of the best rap songs of all-time, in my opinion

Outside of a few sections by Eminem or maybe Logic, this song features the best verse in rap history, starting at 3:33 when Nicky Minaj goes completely feral.

Or if you just want her verse on YouTube, here you go.

Historical context around the famous verse.

Thanks for reading the Friday Speedrun! Sign up for free to receive our global macro wrap-up every week.

More from the Spectra Markets Library

friday speedrun
Friday Speedrun

Degrossed

It’s not so much the “WHY?” as the “WHAT?” that matters most in markets. Keep your eyes peeled for good news / bad price setups.

Read now
subscriber
am/FX

JPY and Cable

Taking profit on the USDJPY and looking for a way to get short GBPUSD for corporate month end.

Read now
highlights
am/FX

Fading

This looks like a good spot to fade the JPY move.

Read now