A messy unwind of some of the most popular trades, along with another post-earnings ramp higher in NVDA.
Fistula, by Kurt Cobain
Hello. It’s Friday. Thanks for signing up. I’m Brent Donnelly.

A messy unwind of some of the most popular trades, along with another post-earnings ramp higher in NVDA.

Fistula, by Kurt Cobain
Hello. It’s Friday. Thanks for signing up. I’m Brent Donnelly.
Here’s what you need to know about markets and macro this week
Funny story to start. Last week I made the analogy of inflation as a maple seed, helicoptering slowly down to the ground…
As a side hobby, I umpire Little League baseball in my town, and on Wednesday I was standing there waiting for the game to start and as I looked out across the middle of the field, I saw a maple seed spinning about six feet off the ground. My immediate thought was back to Friday Speedrun last week and I watched, waiting for the seed to spin down to the ground, just like US inflation.
Weirdly, the seed caught a series of updrafts and floated slowly up, up, and away out of sight.

Foreshadowing??? Anyway. That was weird.
The big release this week was a three standard deviation beat in the S&P Services PMI, much to the chagrin of the many popular debasement and short dollar trades out there. The S&P PMI is a newer series that is similar to the ISM Services release that comes out the first week of the month.
S&P won’t let you look back more than three years without paying for the data, so here are the last 36 monthly misses (actual vs. expected) for the figure.

If we compare the S&P series to the better-known and longer-tenured ISM Services figure, we get an overlay that looks like this:
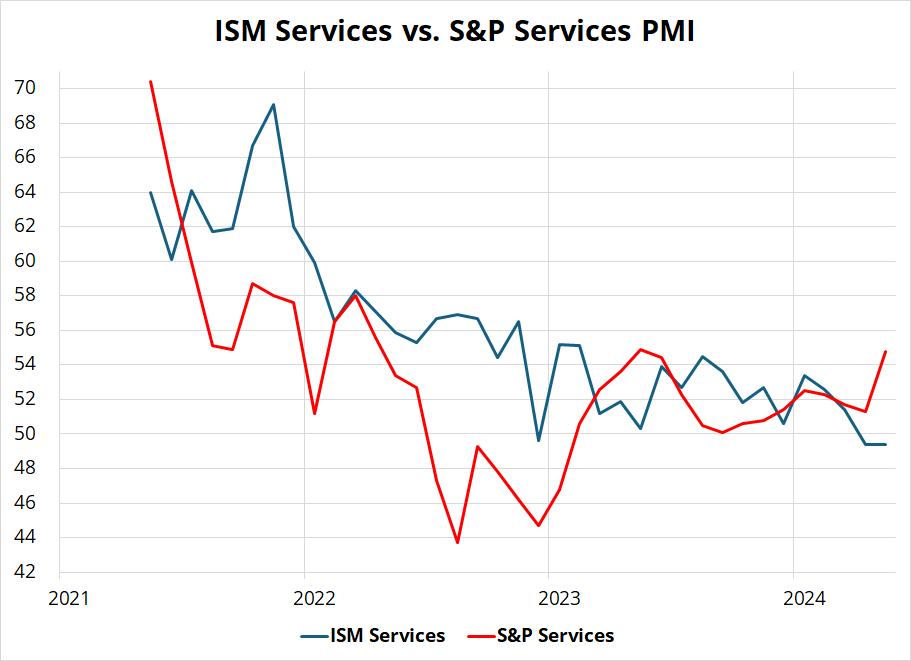
If you squint hard enough, you might see the red line leading the blue line lower, but there is probably more noise than signal in there as far as I can see. Digging into the monthly data, the monthly changes in the two releases look like a shotgun blast. See next chart.
The signs of the changes (i.e., comparing whether S&P Services and ISM Services are stronger or weaker vs. prior month) only match 20 out of 36 times and there doesn’t seem to be any correlation.
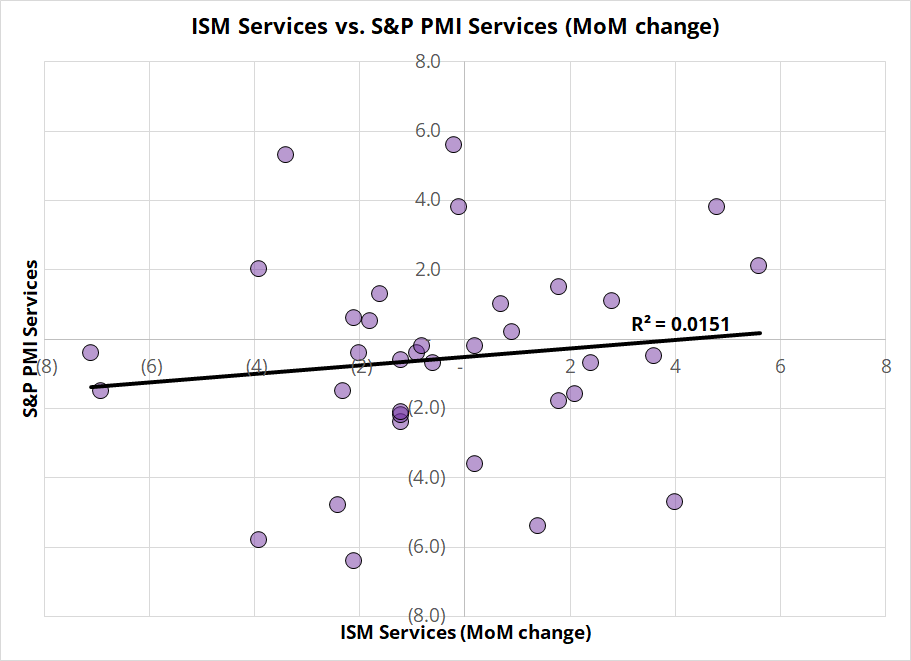
Side note: I have been using Excel since 1997, but still sometimes discover new functions that I didn’t know existed. Today, for example, I was able to use the “SIGN” function to test the sign of the S&P Services MoM data vs. the sign of the ISM Services MoM data (e.g., =AND(SIGN(E8)=SIGN(F8)). Neat. Old dog learns new trick. Woof.
Overall, I would argue the S&P Services PMI may or may not be a red herring. There is not strong evidence that it’s predictive for this month’s ISM Services and it doesn’t dramatically alter my view that we are entering a mild period of softening demand in the US. It definitely doesn’t support my view, but it’s a single data point and it does not invalidate it, either.
What it did, instead, was trigger an acceleration of the short-term wipeout in the most popular trend-follower trades like copper, silver, and gold. Heavy metal, as it were.
That was the other main feature of this week: A messy unwind of some of the most popular trades, along with another post-earnings ramp higher in NVDA.
The weekly macro podcast with Alfonso Peccatiello is here. Weekend listening as we talk about the noise in the data, procyclical hiring practices in finance, and DonaldTrump.
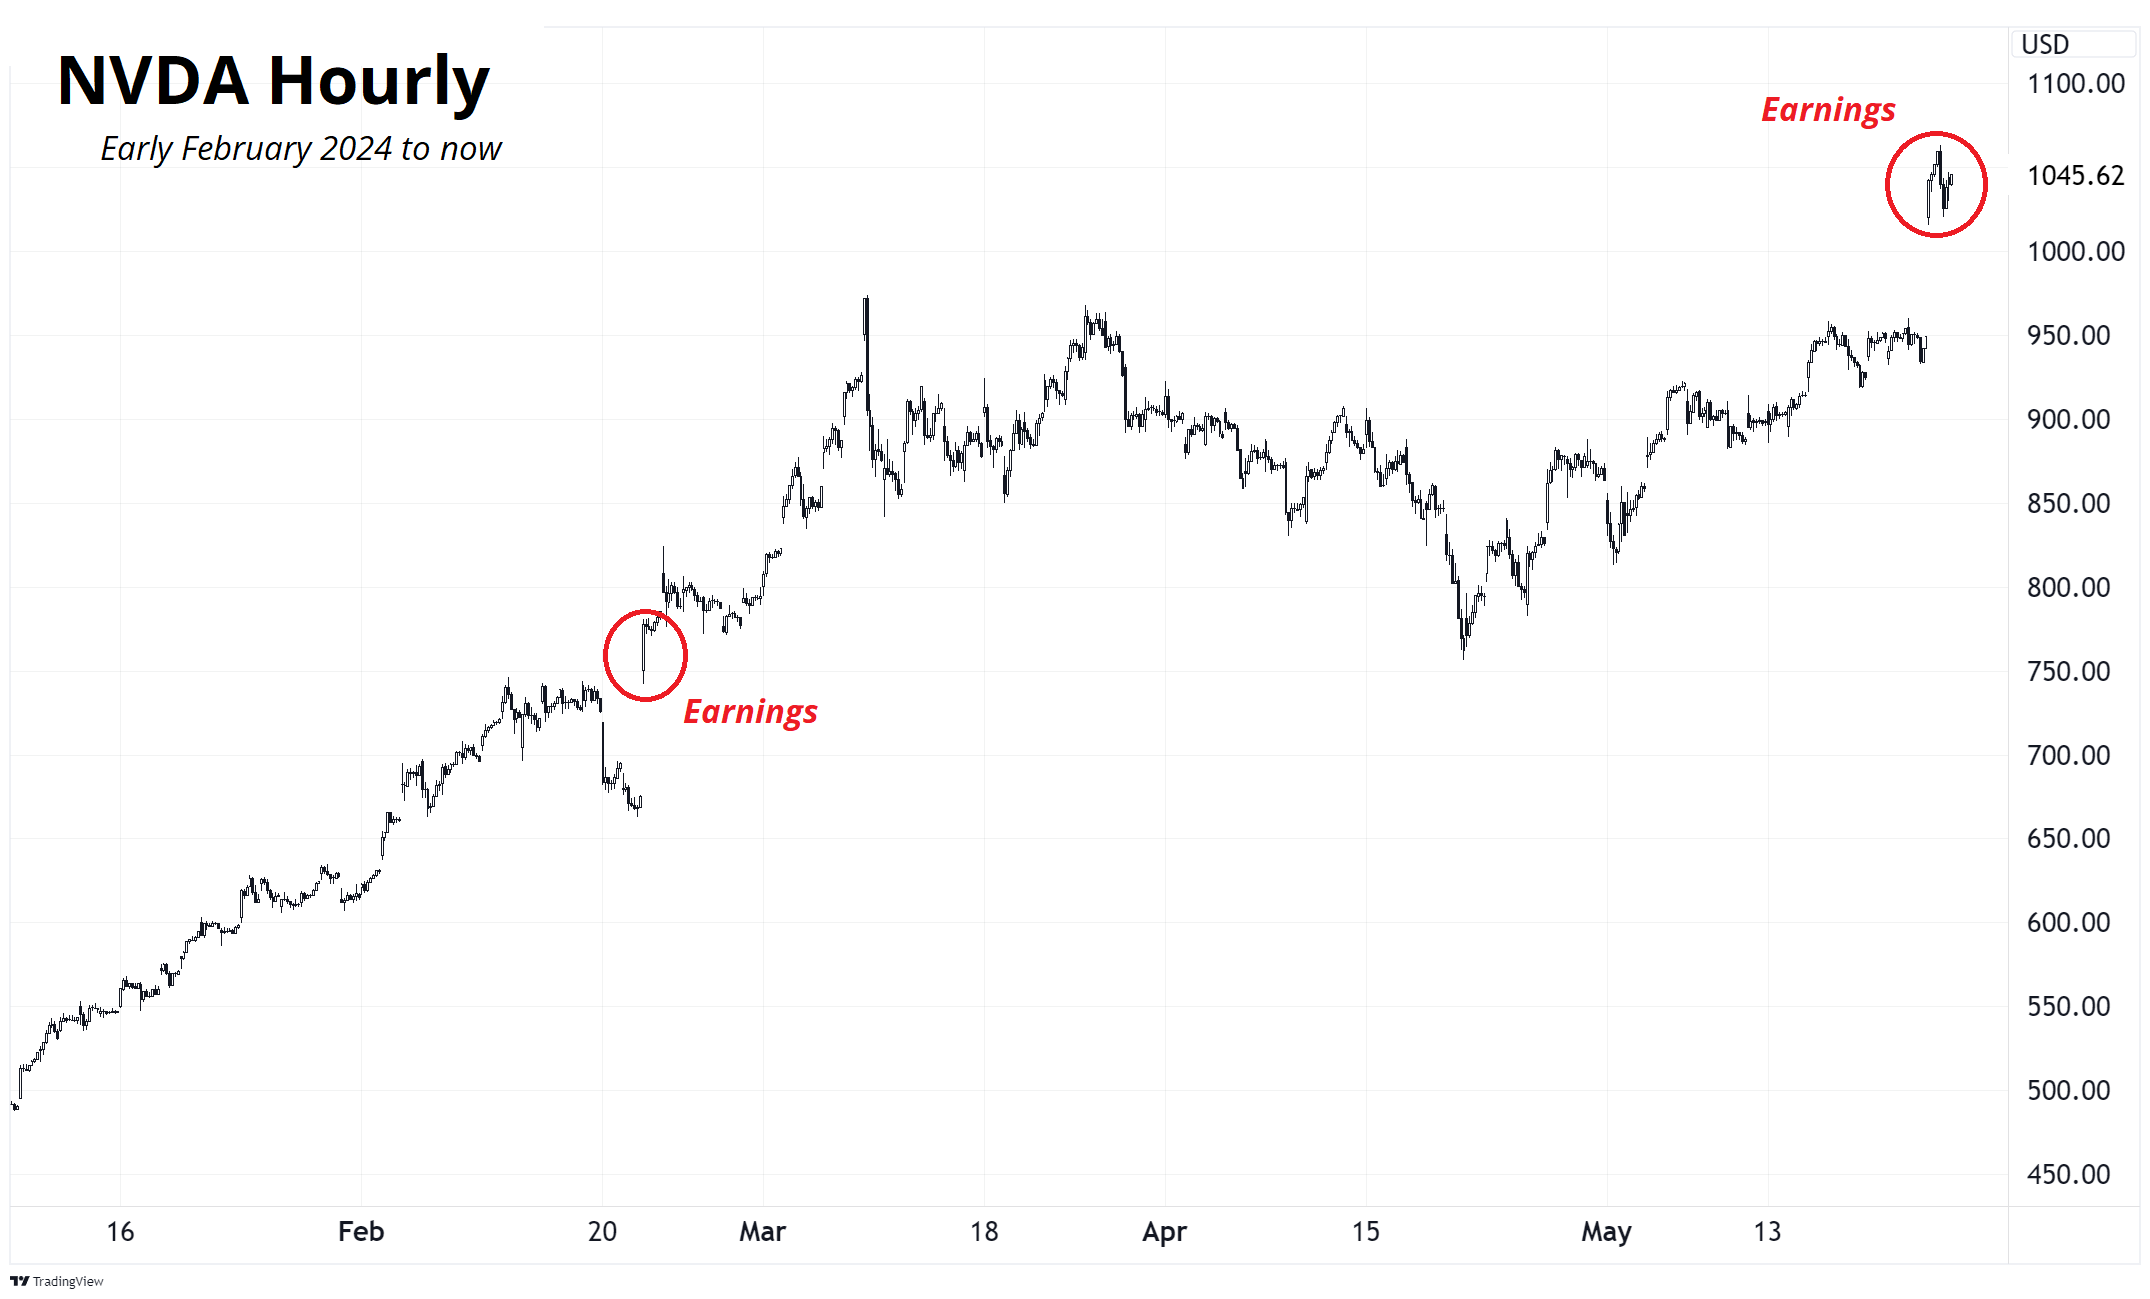
NVDA keeps on rocking in the free world.
The skeptics keep getting wood-chippered like Carl Showalter as earnings growth accelerates at light speed. Speaking of the speed of light… A joke.
If you are traveling in a spaceship at the speed of light, and you turn on the headlights… What happens?
– Stephen Wright
NVDA earnings came out Thursday, right in the middle of a weird positioning-driven wipeout in all the momo trades, so you had the very rare situation of NVDA up almost 10% with the NASDAQ down hard. This is extremely rare due to the high correlation between tech stocks, but also because NVDA itself is 6.5% of the index and therefore a 10% rally in NVDA is going to be a huge levitational force on the NDX.
It all spews out a totally bananas Thursday heatmap:

The market recovered today and the VIX is burrowing lower again. Currently 12.38. Following the wild ride this week, the S&P 500 is just 0.8% away from the all-time high. That means basically everyone that ever bought and held an S&P 500 Index Fund throughout the history of the modern world is ITM.
Here is this week’s 14-word stock market summary:
NVDA steals the show as bulls remain firmly in control. Holidays are bearish vol.
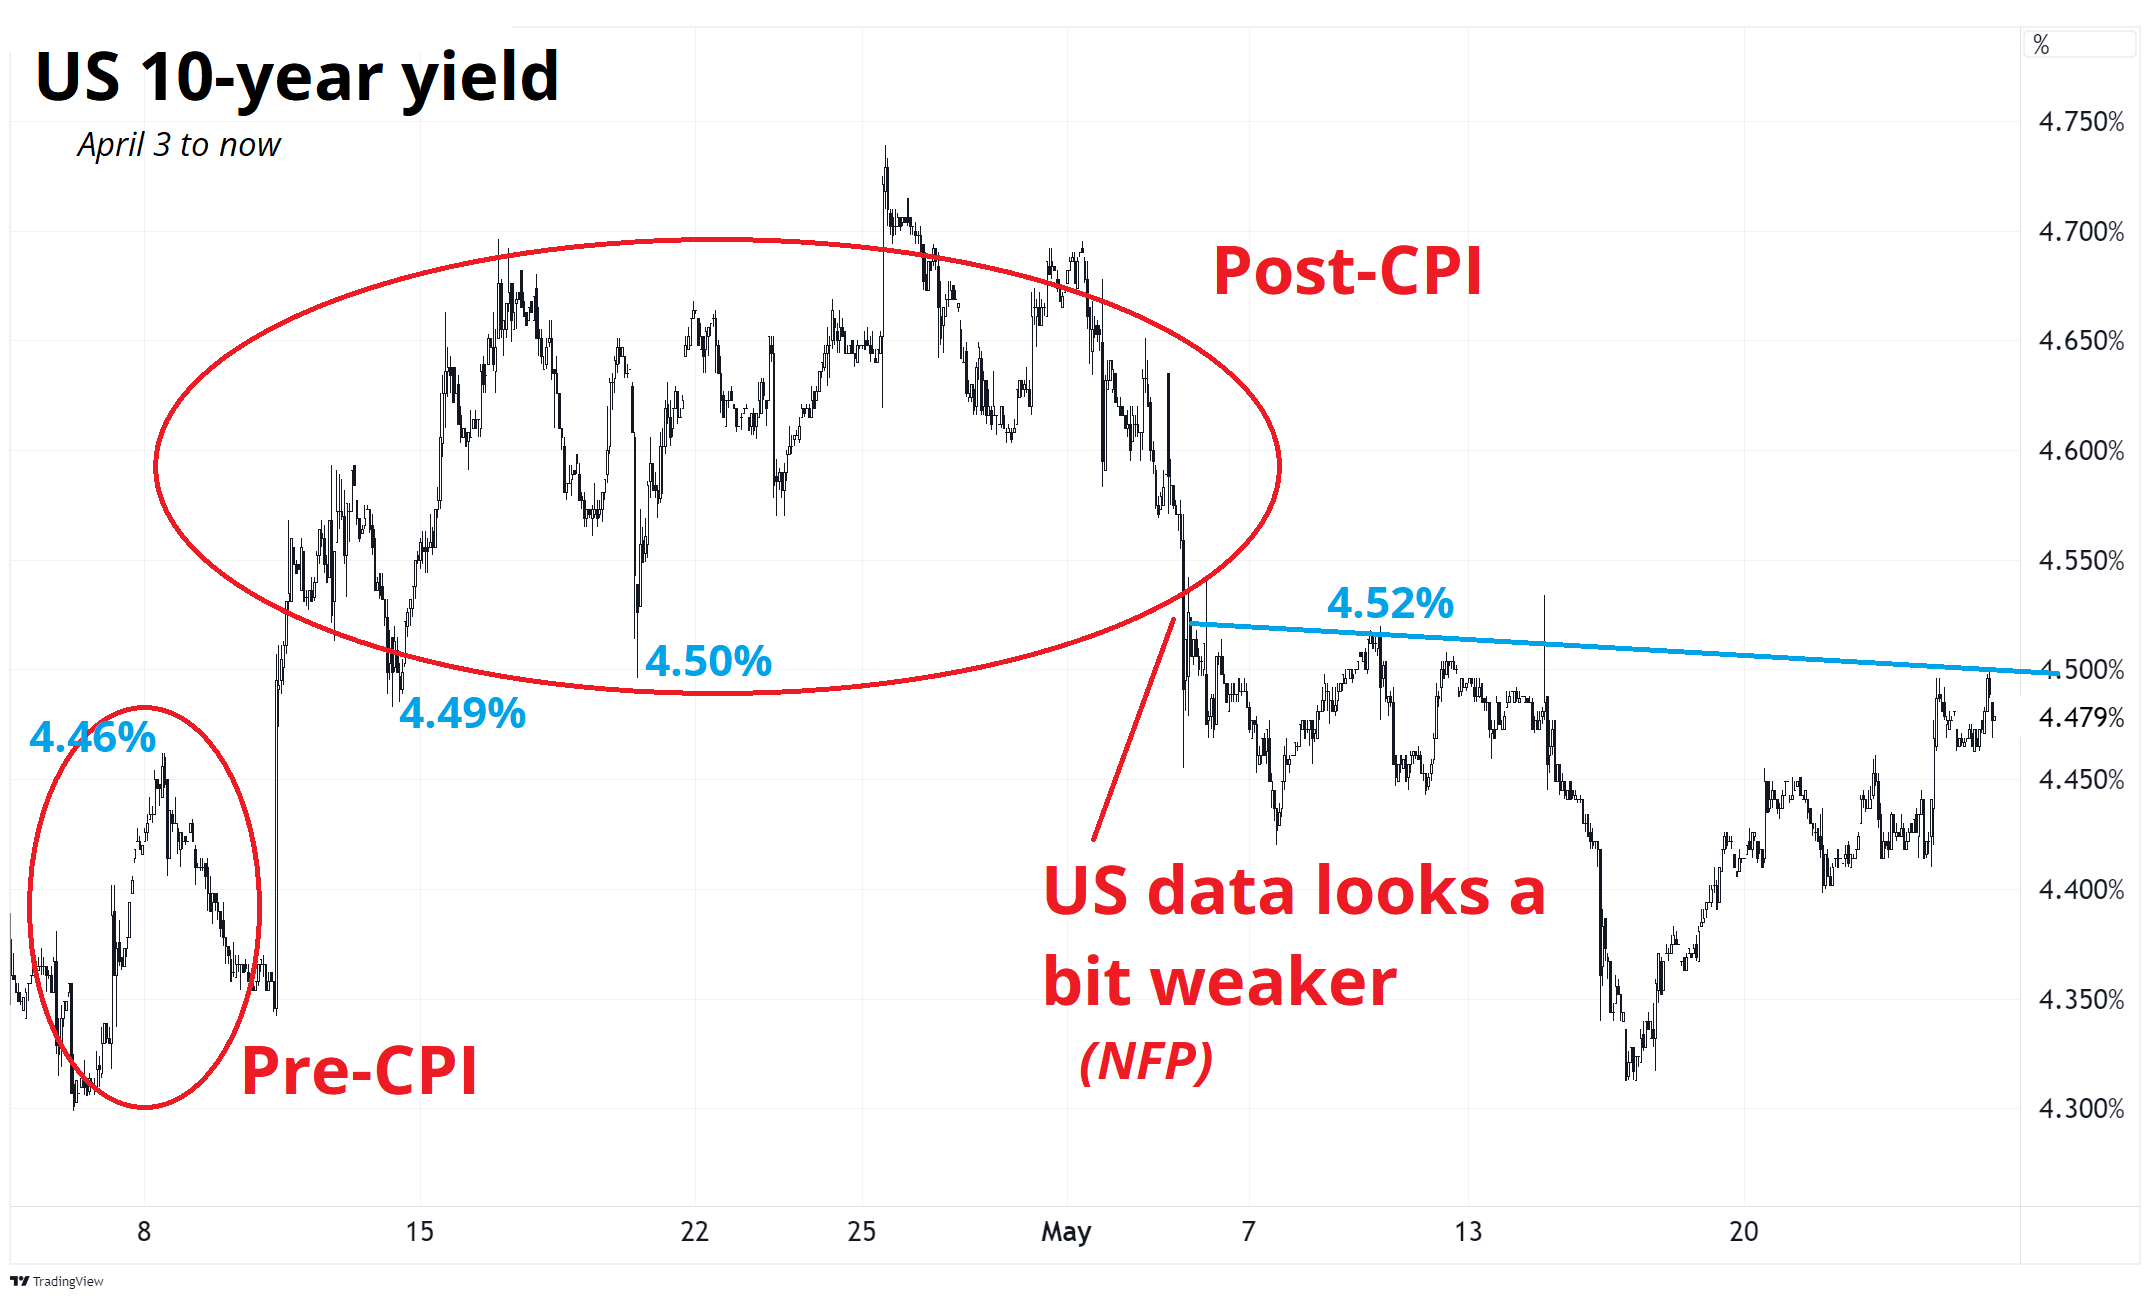
Updating last week’s chart of US 10-year yields, you can see that we are still in the sub-CPI equilibrium zone, but we are up near its ceiling. Before the CPI release on April 10th, 4.5%ish was the top of the range, post-CPI it was the bottom of the range, and then after the NFP data released May 3 came in weak, we were capped at 4.50% again. Yields are 4.47% right now.
Astute observers will note that the slightly angled cyan line marks the neckline of an inverted head and shoulders.
Note for newer people in finance. Two paragraphs ago, I said “the CPI release on April 10th” to be clear because it’s the March data, released in April. If you say “April CPI” it sounds like you’re talking about the April data. If you say “March CPI” it sounds like you might be talking about a data release from March. Clarity is always good when communicating about financial markets. Sure, it’s kind of pedantic, but words have meaning, as Cuppy D says.
When looking at equilibrium zones, Market Profile (aka Market Picture) can be useful. The next chart shows the Market Profile for US 10-year yields. The concept is to take out the intraday time axis and show instead how many periods the price of the security spent around each price, each day. The more letters beside a price, the longer it spent there and the more indicative that level is of some sort of equilibrium. If price jets through an area without trading there much, that is a pivot or disequilibrium zone.
I have mistyped the word equilbirium every single time in here and corrected them all. Except that one. And any future ones. I’m tired of correcting equilbirimu typos.
If you’d like to learn more, there are many books and websites about Market Profile. My favorite is “Mind Over Markets” by Dalton. And this 346-page PDF.
Here is the 30-day Market Profile for the US 10-year yield (using MKTP on Bloomberg). Each vertical stack is a day and the fatter the stack, the more it traded at a particular price. Tall stacks are big day ranges; small fat stacks are boring days.
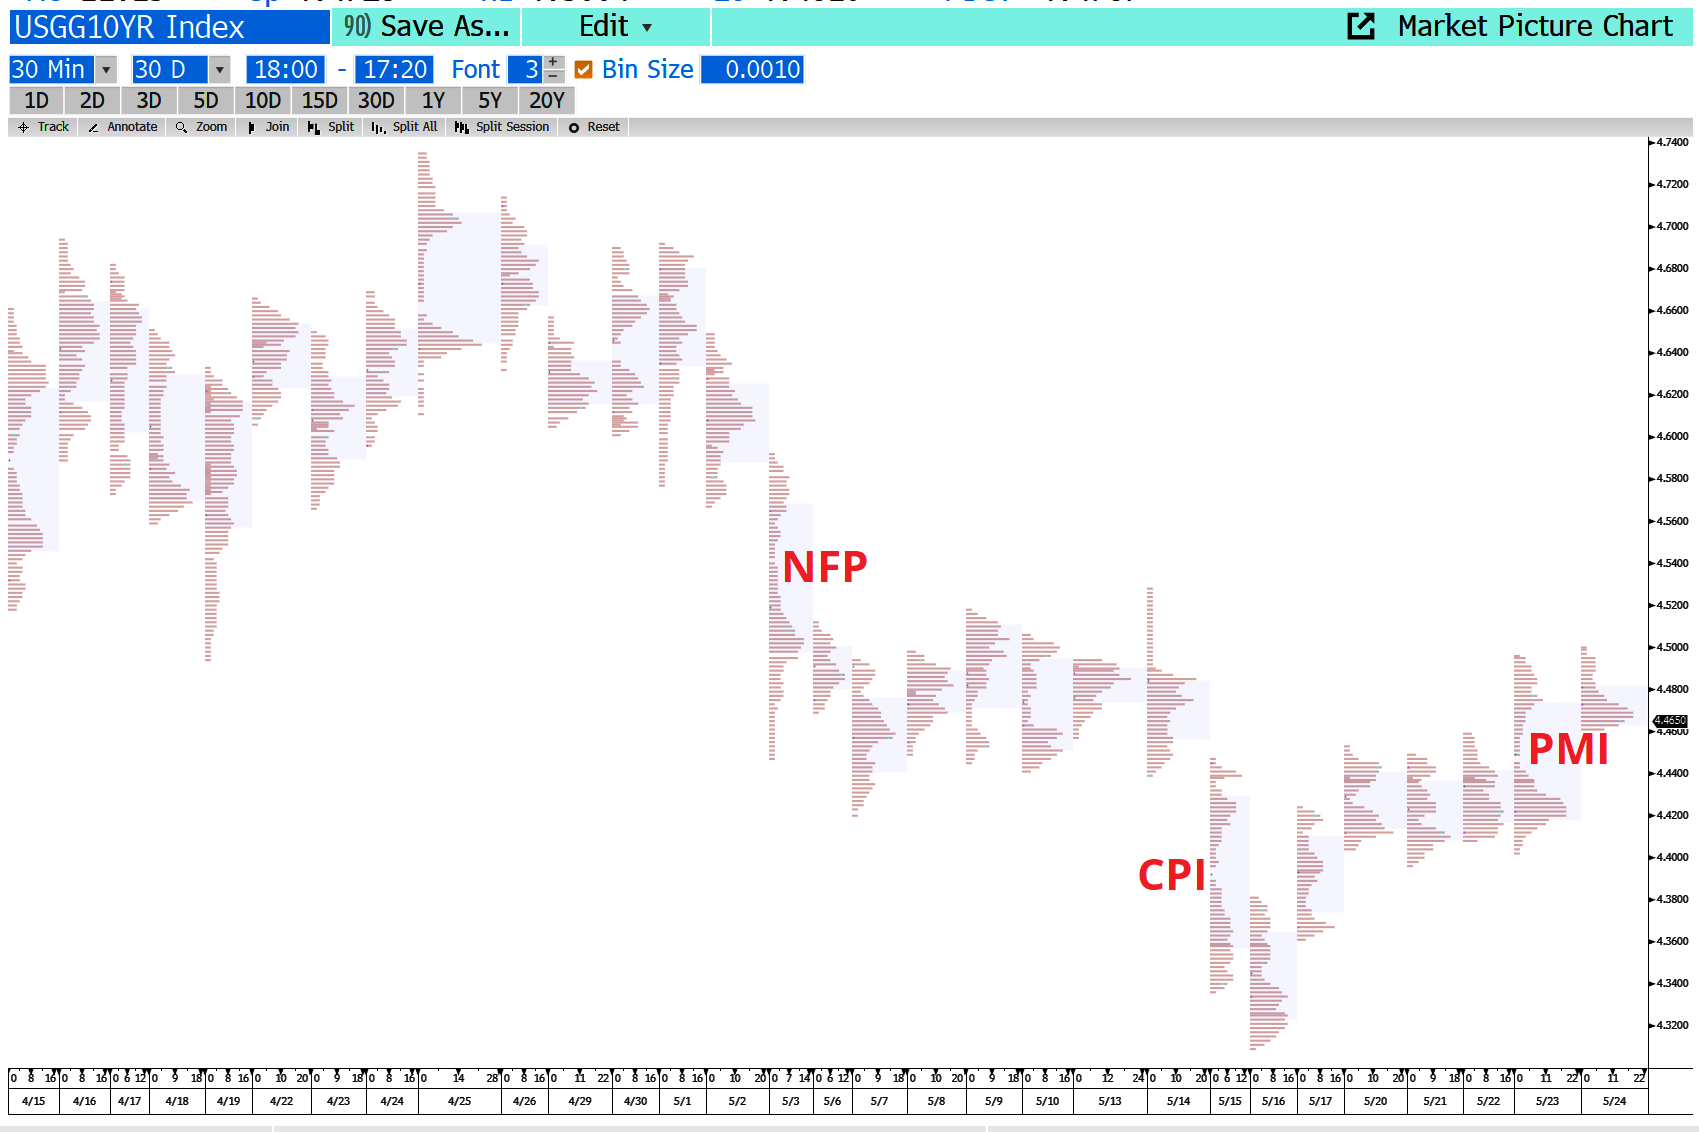
The output is similar to a candlestick chart, but you see some different nuances. The most useful output from these charts are “single prints”. Those are price points where the security only traded there in one time interval of the day. You can see where I put “PMI” in red, yields jumped up and barely traded in the small zone there (4.44% to 4.46%). Single prints are marks of extreme disequibrium and work as good pivots for short-term trading.
Outlook: Despite the strong S&P PMI, I still think US consumer demand is weakening modestly as excess savings have been spent and the job market softens. I would rather bet on lower yields than higher.
FX traders have been sad of late as we are in a period of low volatility and random, choppy, hard to decipher price action. Trading events can be a refuge from this sort of bleh market, but even those have been sketchy of late.
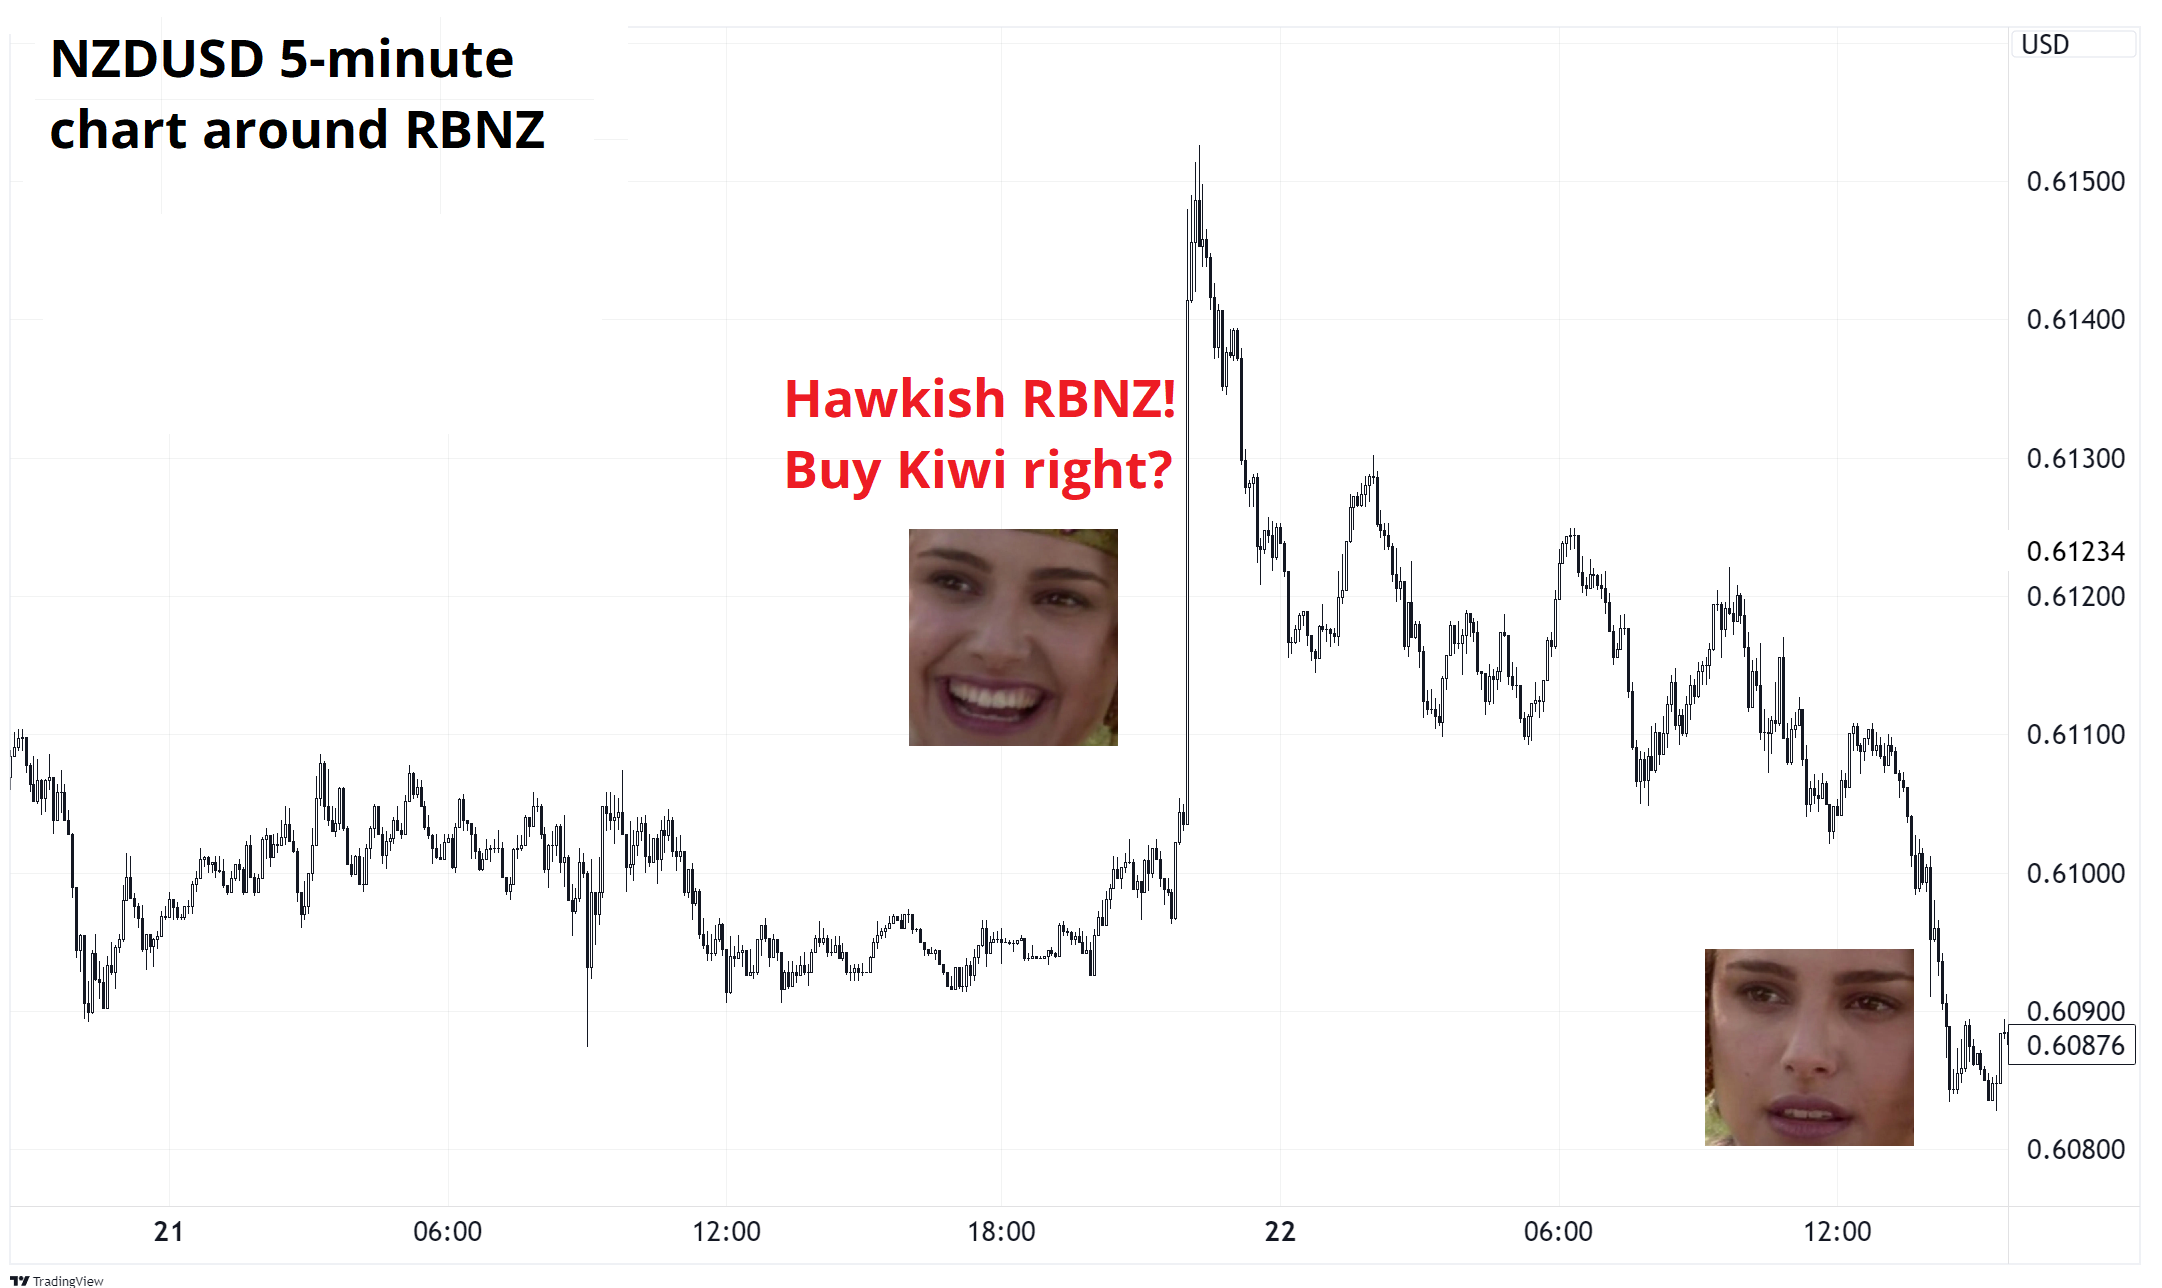
For example, the Reserve Bank of New Zealand came out much more hawkish than expected this week. The market has been focused on the yawning output gap in NZ (and household vulnerabilities) and most have been leaning towards the possibility of cuts. Instead, the guvnah was saying the word “hike” right after the words “interest rate”. That would normally be a major green light to buy the currency because higher rates, ceteris parabus, attract capital.
Here’s what NZDUSD did.
Currencies have not been the place to be.
Should we fire all the currency traders then? Probably not. That would be an extrapolation bias error. Markets like EM, Credit, commodities, and FX are highly cyclical. Here’s something I wrote in am/FX this week:
It would stand to reason that much as macro traders were in heavy demand in 2022, then there was a culling in late 2023… There are going to be cuts for FX traders soon if currency vol doesn’t pick up.
Meanwhile, everyone is opening a commodity fund and paying up for commodity traders. Yet it was impossible to raise money for a commodity fund in 2017, for example. I remember the same thing in 2007, when Lehman hired scads of new EM traders after a 7-year bull run in emerging markets.
This procyclical hiring and firing cannot be good for business, can it? Has anyone ever seen a firm that hires countercyclically instead of procyclicality? That seems like it would be an edge. Still, it may be impossible due to investor and management metagame and career risk.
Hiring a commodity trader now and firing an FX trader is easy to justify right now, but probably negative EV. Procyclical extrapolation bias dominates hiring and firing of traders, but investors are procyclical too, so maybe it’s their fault? Investors chase past performance and the hottest asset classes and thus the money comes in and needs to be deployed and so firms simply react to that much of the time. Anyway, just something to think about. Even if you can’t be countercyclical, you can at least be less procyclical.
I am unconditionally optimistic on FX. But then again, I kind of have to be. It is a Pascal’s Wager sort of situation. Better to believe in FX than to consider the ramifications of not believing.
ETH approval FTW.
I go through a ton of crypto material, and everyone has concluded that this ETH ETF approval is a regulatory sea change as the idea that “maybe ETH is a security?” seems to have been jettisoned and that is an important volte face by regulators. Furthermore, it is assumed that a Trump administration will be much more crypto-friendly that the Biden one, and Donald is currently leading the race 55%-45% approx.
Alex Tabarrok wrote a succinct piece which summarizes the zeitgeist as discussed on various crypto media networks that I follow. I’m just gonna put the whole piece here because it’s so short it feels stupid to excerpt from it.
In the last few weeks there has been a sea change in crypto regulation:
1. Bitcoin spot ETFs were approved–reluctantly, after a 3-judge Federal Appeals court ruled unanimously that the SEC had acted arbitrarily and capriciously–but nevertheless opening Bitcoin holdings to institutional investors. Case in point, The State of Wisconsin bought Bitcoin ETFs for its pension fund.
2. In a very unusual move, SAB 121, was overturned by the House and then, even more surprisingly, overturned by the Senate including the votes of many Democrats. SAB 121is an SEC staff accounting bulletin (not law but guidance) that said to banks if you hold crypto for your customers, i.e. a custody service, you must account for it on yourbalance sheet. This guidance does not apply to custody of any other asset. Essentially, SAB 121 made it prohibitive for banks to offer custody services for crypto because that service would then impact all kinds of risk and asset regulations on the bank. Aside from singling out crypto, the SEC is not a regulator of banks so this seemed like a regulatory overreach.
President Biden said he will veto but that is no longer certain. It wasn’t just crypto lobbying against SAB 121 but traditional banks. The banks point to the approval of Bitcoin ETFs saying, quite logically, why can’t we custody these ETFs the way we do every other ETF? Senate Majority leader Chuck Schumer, D-N.Y., sometimes called Wall Street’s man in Washington, voted in favor of nullifying SAB 121. Schumer can read the room.
3. The House voted to ban the Fedfrom establishing a Central Bank Digital Currency (CBDC).
4. The House approved a wide-ranging billto (finally!) establish regulations for digital assets markets. The vote was 279-136 in favor with many Democrats crossing party lines to support it.
5. After saying nothing for months, usually a bad sign, the SEC approved Ethereum spot ETFs. On the surface, this might have seemed logically inevitable given the approval of Bitcoin spot ETFs but many people thought the SEC would do everything it could to find daylight between Bitcoin and ETH. Instead, it tacitly acknowledged that ETH is a commodity and not a security.
Why is this happening? I see three main factors at play. First, crypto is becoming integrated with traditional finance. As the big banks get involved, the politics around crypto are shifting. Second, crypto is becoming normalized. Ironically, the prosecution of Sam Bankman-Fried, Changpeng Zhao and manipulators like Avraham Eisenberg may have convinced some U.S. regulators that crypto doesn’t have to be destroyed, it can be tamed. Nakamoto might not be pleased but realistically this was the only option to move forward. Eventually, everyone wants to pay their mortgage. Third, Trump’s strong endorsement of crypto has alarmed the Biden administration. Most political issues are firmly divided along party lines, but crypto remains an open issue. With millions of crypto owners in the United States, a significant number are highly motivated to vote their wallets. Biden doesn’t want to give the crypto issue to Trump.
None of this means we are entering crypto Nirvana but as far as regulation is concerned a lot has changed in just a matter of weeks.
Major correction after ebullient trading.
I think it’s interesting that $30, the multi-year post-COVID megapivot in silver, held almost to the cent overnight. See chart.
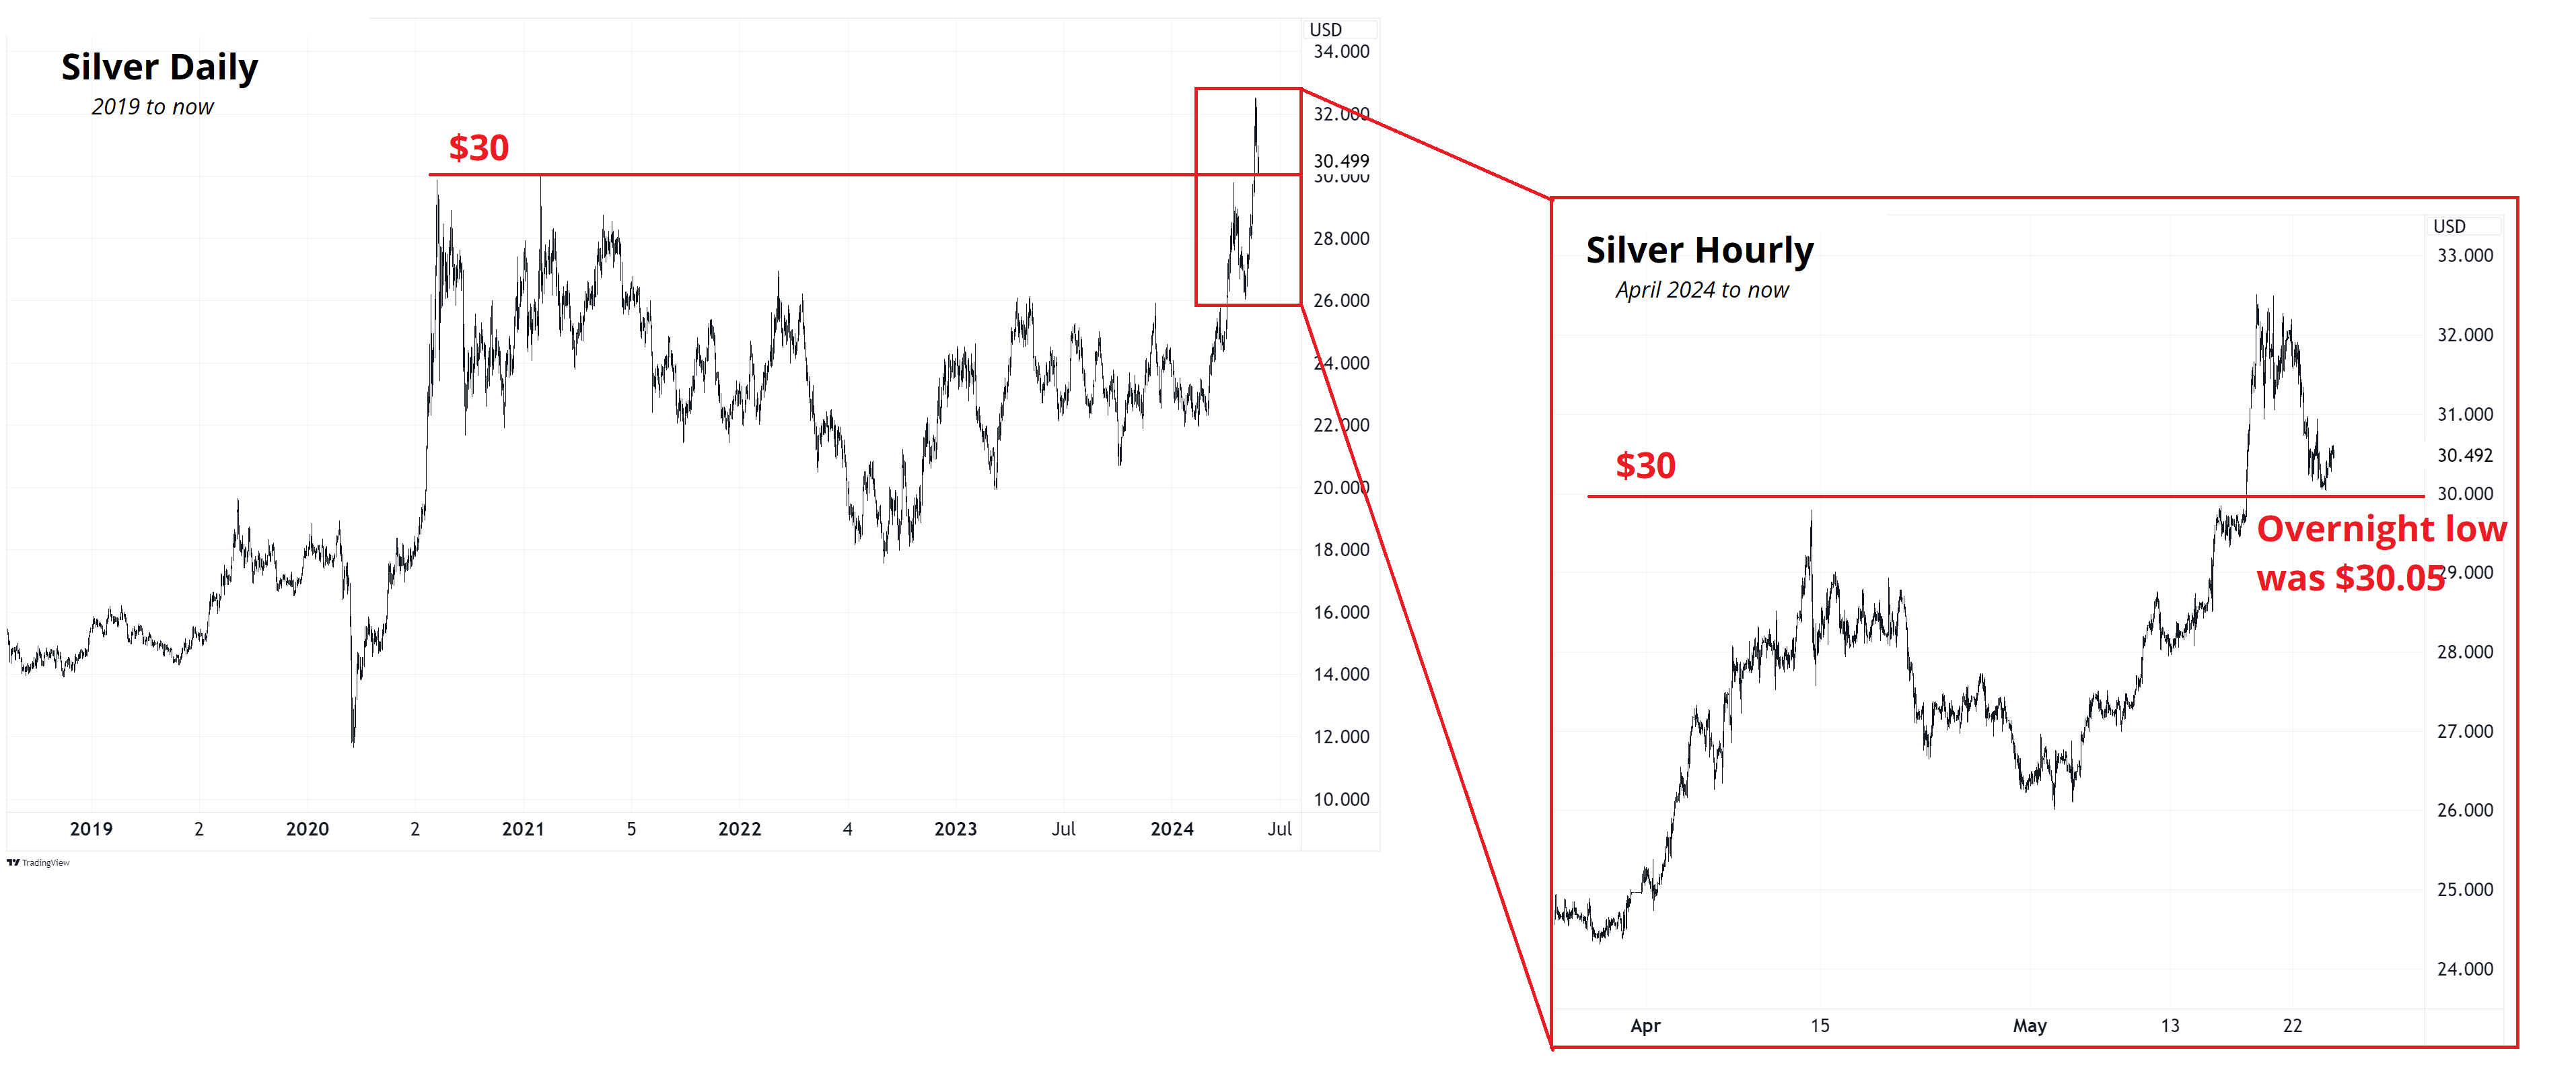
I don’t have much of a view on commodities, but I will say if you are long, you should be concerned about liquidity and VAR going forward. The flood of new money coming into commodities is going to lead to some crowding.
We saw in 2007, when the fashion of “commodities as an asset class” first emerged, that commodities markets aren’t big enough to handle massive herds of speculators all stampeding in one direction.
OK! That was 10 minutes. This thing has been longer than usual over the past month or so. Does that bother you? Do you wish it was shorter or you don’t really care? Let me know by email. Thanks.
Get rich or have fun trying.
Smart, interesting, or funny
How Coors got big in Japan. This is unbelievably cool. HT NJonas.
My dad’s open rate is 95%.
Music
Legendary letter from Steve Albini to Nirvana
Same letter, easier to read format
Post Malone does Heart-Shaped Box
Meat-eating orchids forgive no one just yet
Cut myself on angel hair and baby’s breath
Broken hymen of Your Highness, I’m left black
Throw down your umbilical noose so I can climb right back
And finally… A painting by Kurt Cobain that you might recognize.

Incesticide by Kurt Cobain.
Thanks for reading the Friday Speedrun! Sign up for free to receive our global macro wrap-up every week.
